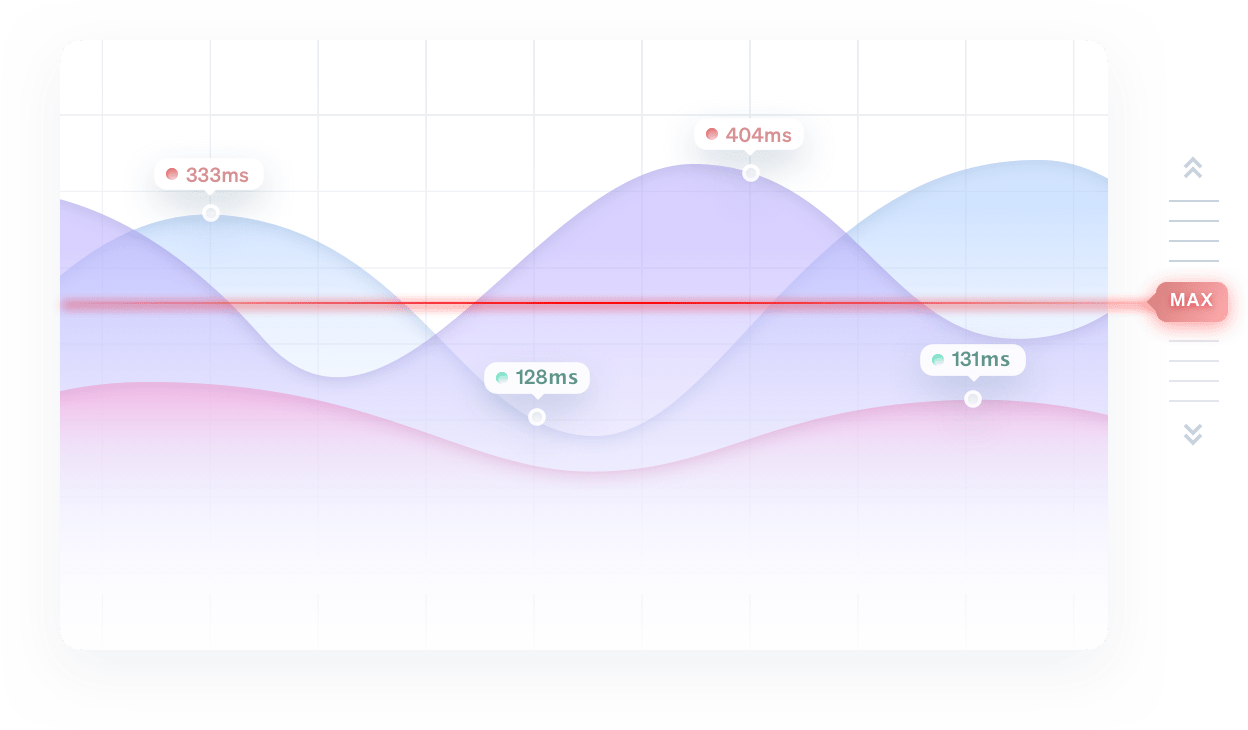
Set a maximum performance budget
Without constant monitoring and reporting, how would you know if you're still within your performance goals?
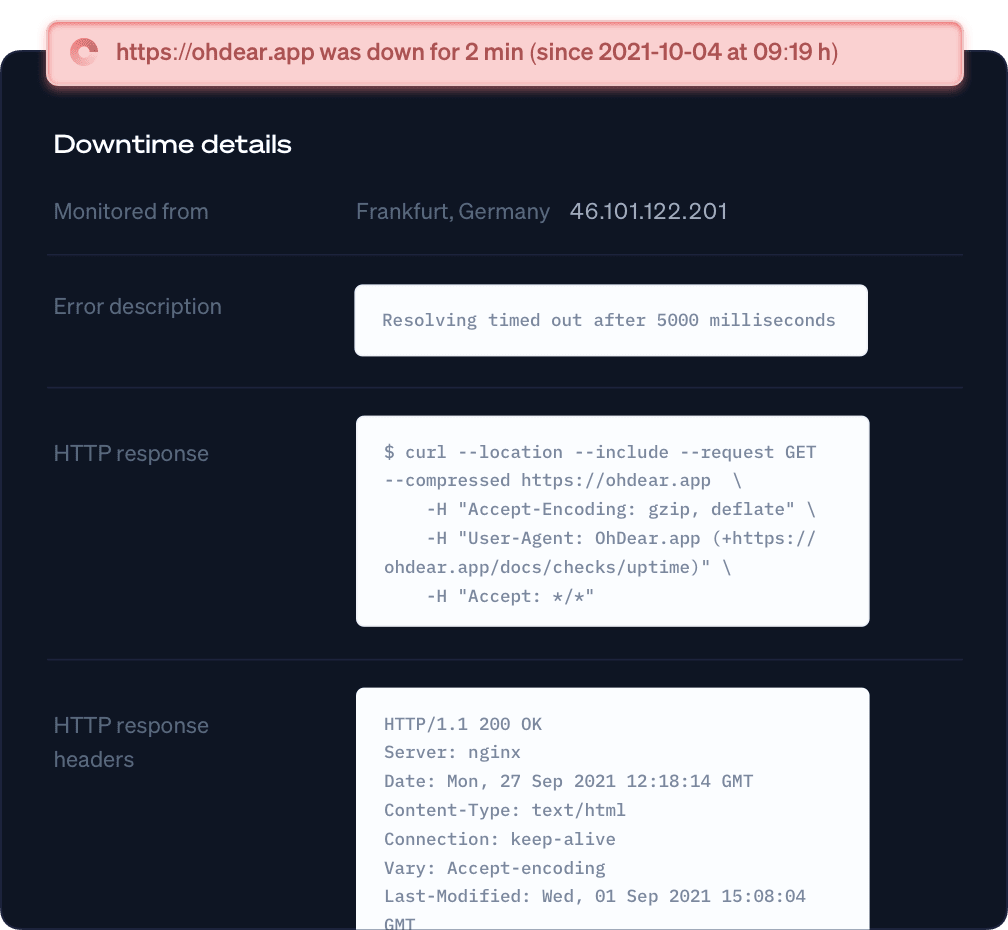
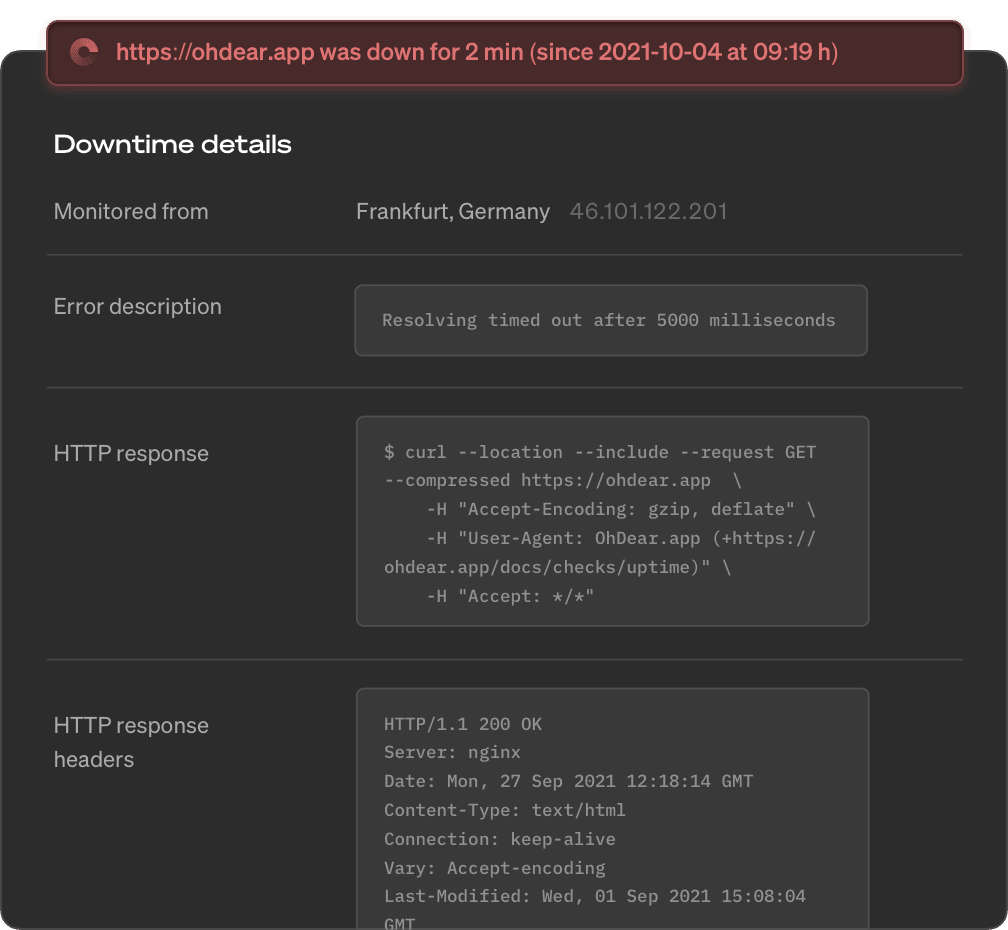
In Oh Dear, you can configure the maximum loading time for any website or API endpoint. Once it's exceeded, we can let you know.
Do you always want to have the sites loaded under 500ms? We can help you monitor that!
| Component | Value |
|---|---|
| Url | https://urlxyz.com |
| Error description | Operation timed out after 5001 milliseconds with 0 bytes received |
Downtime verified from Paris, France and Bangalore, India
Downtime verified from Paris, France and Bangalore, India
urlxyz.com has recovered after 2m. full report: https://ohdear.app/monitors/83/checks/411
urlxyz.com seems down! Error: HTTP/500 Downtown verified from Paris, France and Frankfurt
Pushover has been successfully enabled. We'll notify you when something goes wrong.
 ntfy
ntfy
urlxyz.com has recovered after 2m. full report: https://ohdear.app/monitors/83/checks/411
ntfy
urlxyz.com seems down! Error: HTTP/500 Downtime verified from Paris, France and Frankfurt
ntfy
ntfy has been successfully enabled. We'll notify you when something goes wrong.
urlxyz.com has recovered after 2m. full report: https:/ohdear.app/monitors/83/checks/411
urlxyz.com has recovered after 2m. full report: https:/ohdear.app/monitors/83/checks/411
Text messages for urlxyz.com have been successfully enabled. We'll notify you when something goes wrong.
$_TOKEN="your API token"
$ curl -X GET "https://notifyservicexyz.com/api/alert/urlxyzcom" \
-H "Authorization: Bearer $_TOKEN" \
-H "Accept: application/json" \
-H "Content-Type: application/json"
urlxyz.com has recovered after 2m. full report: https://app.opsgenie.com/monitors/83/checks/411
urlxyz.com seems down! Error: HTTP/500 Downtown verified from Paris, France and Frankfurt
Opsgenie has been successfully enabled. We'll notify you when something goes wrong.
urlxyz.com has recovered after 2m. full report: https://pagerduty.com/monitors/83/checks/411
urlxyz.com seems down! Error: HTTP/500 Downtown verified from Paris, France and Frankfurt
PagerDuty has been successfully enabled within Oh Dear. Notifications are enabled.
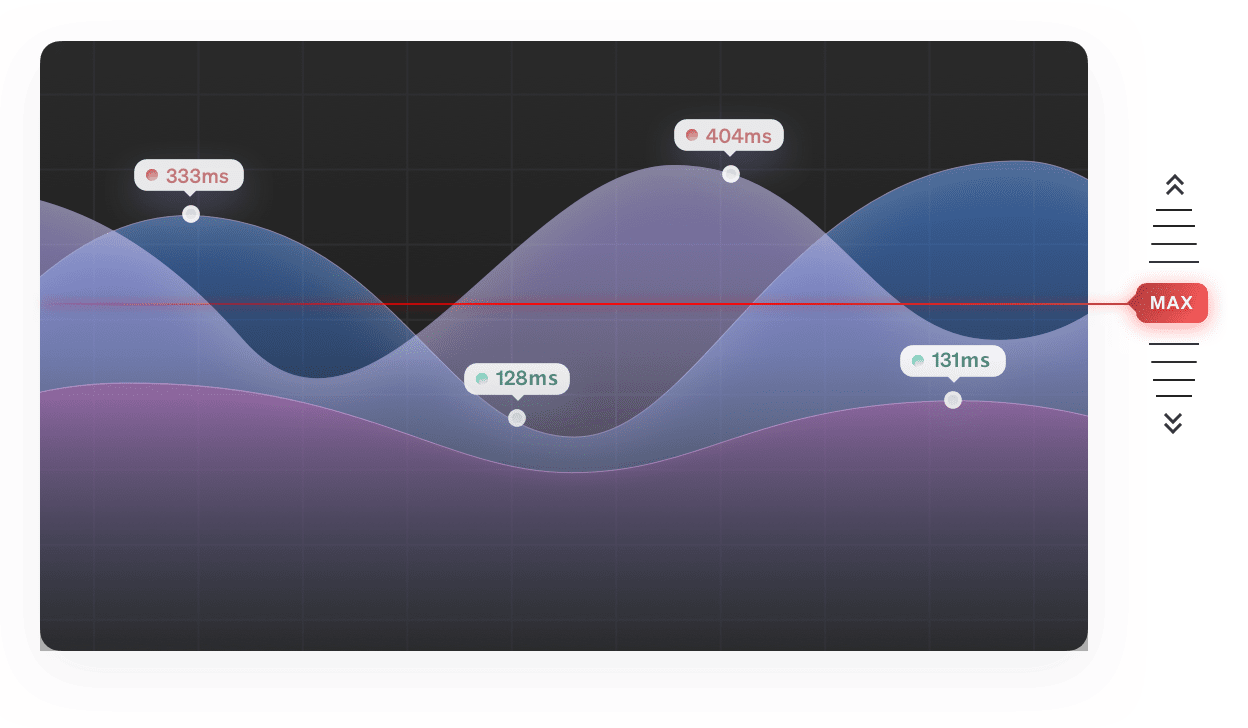
Receive smart and instant alerts
We believe in two kinds of important alerts when it comes to performance: hard limits and sudden changes.
Per website, you're able to define a hard performance limit that should not be crossed. Once we detect the website is consistently crossing that threshold, we'll let you know.
It's very powerful to know when your site suddenly becomes faster or slower. It could be due to increased load on your servers, it could be a faulty new deploy that only renders half the page, ... whatever it may be, you'll find our sudden change alerts worthy of your attention.
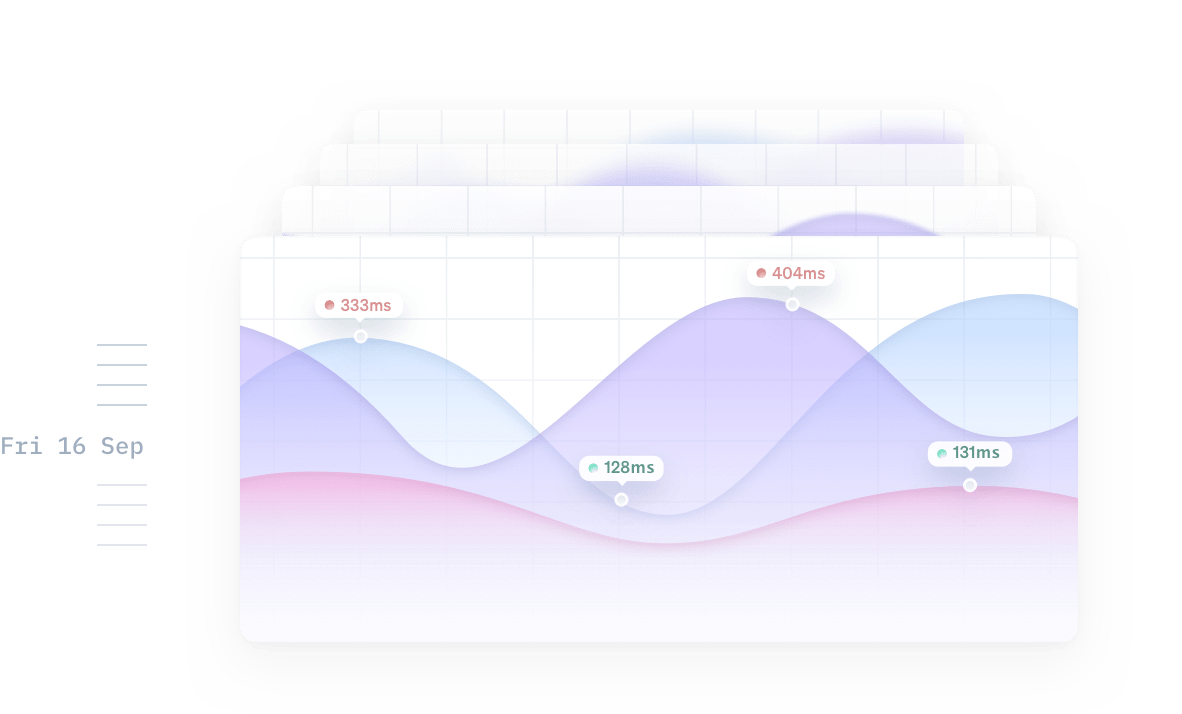
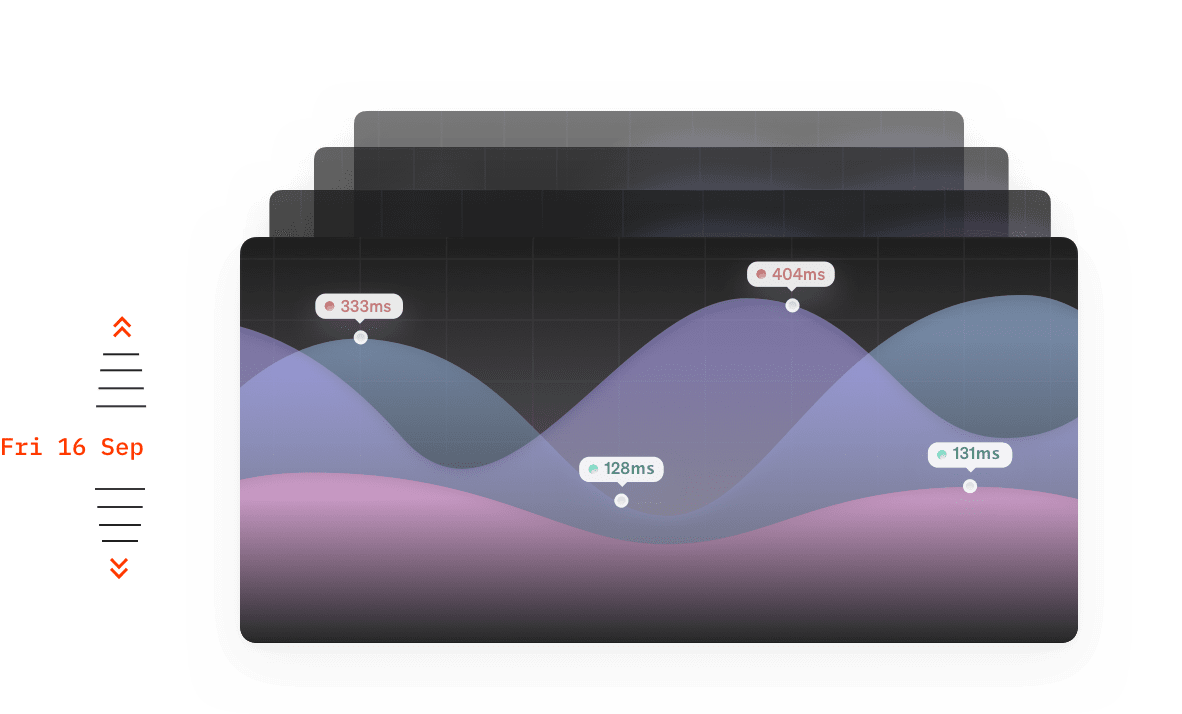
View a detailed history
We keep detailed metrics with every check we perform. Over time, it becomes more useful to see aggregates of this data - trending metrics that tell you at a glance if things are improving or not.
You'll be able to see the last 7 day summary for every site, together with all historic trending data from the moment the site was added to Oh Dear.
Right from your dashboard, you can see if your sites are getting faster or if they're slowing down.
 laravel.com
 ign.com
 takeaway.com
Keep an eye on the dashboard
Your dashboard will give you a birds-eye view of all performance charts for your sites. If things are too slow, we'll clearly mark them out so you can quickly get a feel for all your websites in a single screen.
You can click through to see extra information or configure the sensitivity of each alert.
Stop worrying, start monitoring
Start a no-strings-attached 10-day free trial. You're all set in less than a minute. (No credit card needed.)
Not convinced yet? Need help? Get in touch via support@ohdear.app.
Let’s get technical (if you’re into that)
You don’t need to be computer savvy to set up our tool. But if you are, we’re happy to explain exactly how it works and how you can customize Oh Dear to your specific needs.
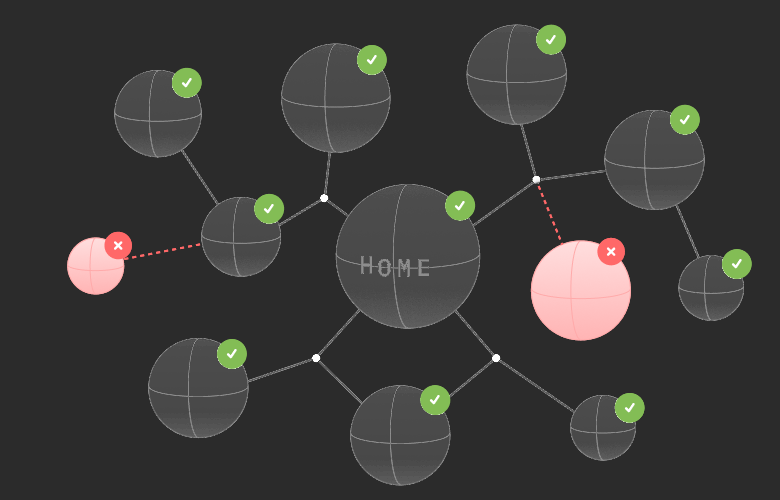
Multi-location performance monitoring
Your website's performance varies dramatically depending on where your visitors are located. A site that loads quickly in New York might be painfully slow in Tokyo or São Paulo.
Oh Dear monitors your website's performance from multiple geographic locations worldwide, giving you a complete picture of how your global audience experiences your site.
Identify regional performance bottlenecks, optimize your CDN configuration, and ensure a fast experience for users no matter where they are in the world.
Monitor your API's performance
You can monitor websites and API's using Oh Dear. For API monitoring, you can configure additional payloads to monitor individual API endpoints.
Frequently asked questions


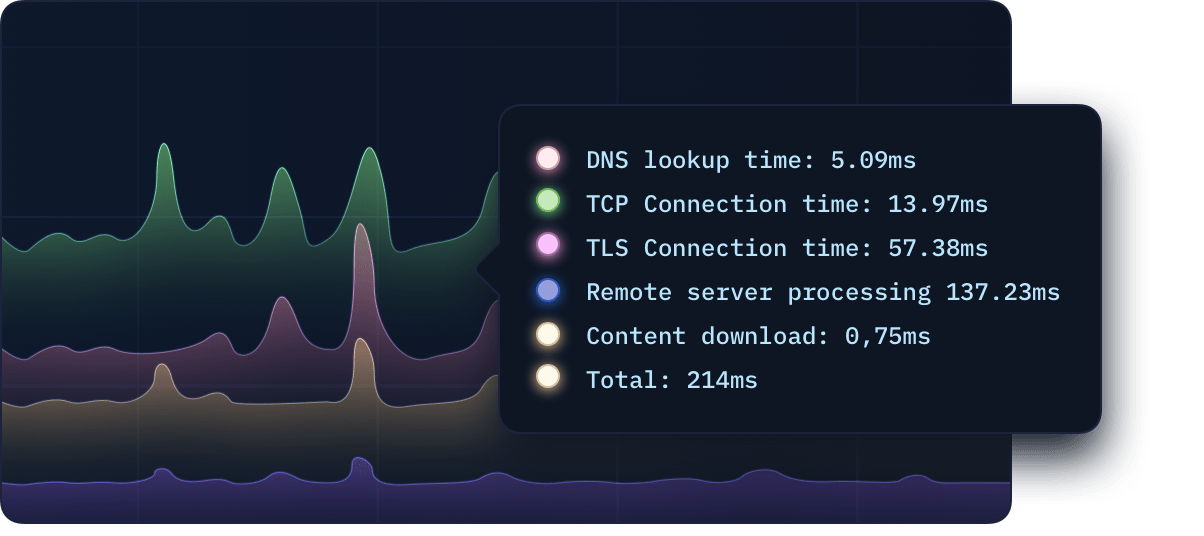
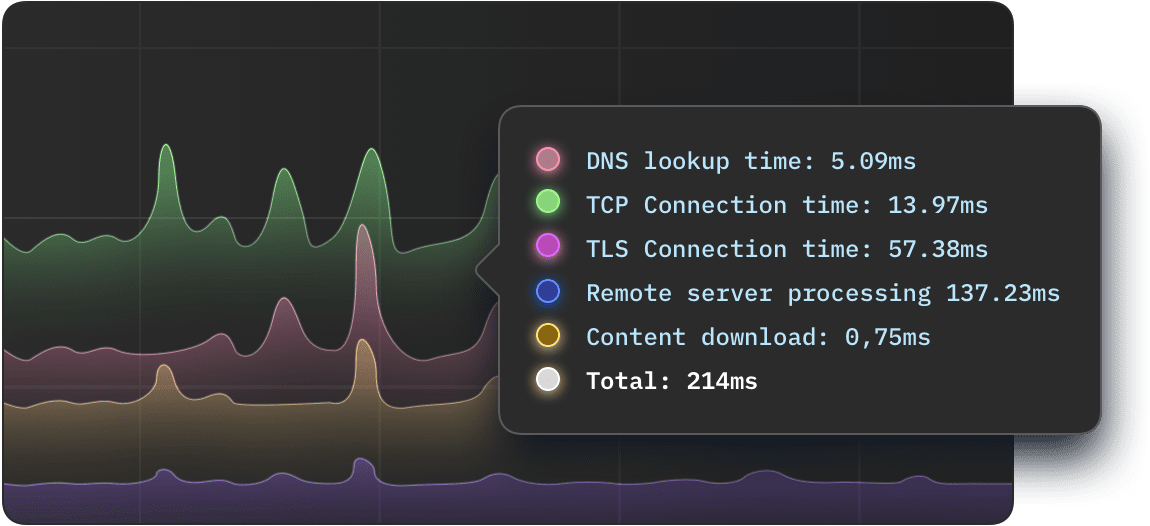
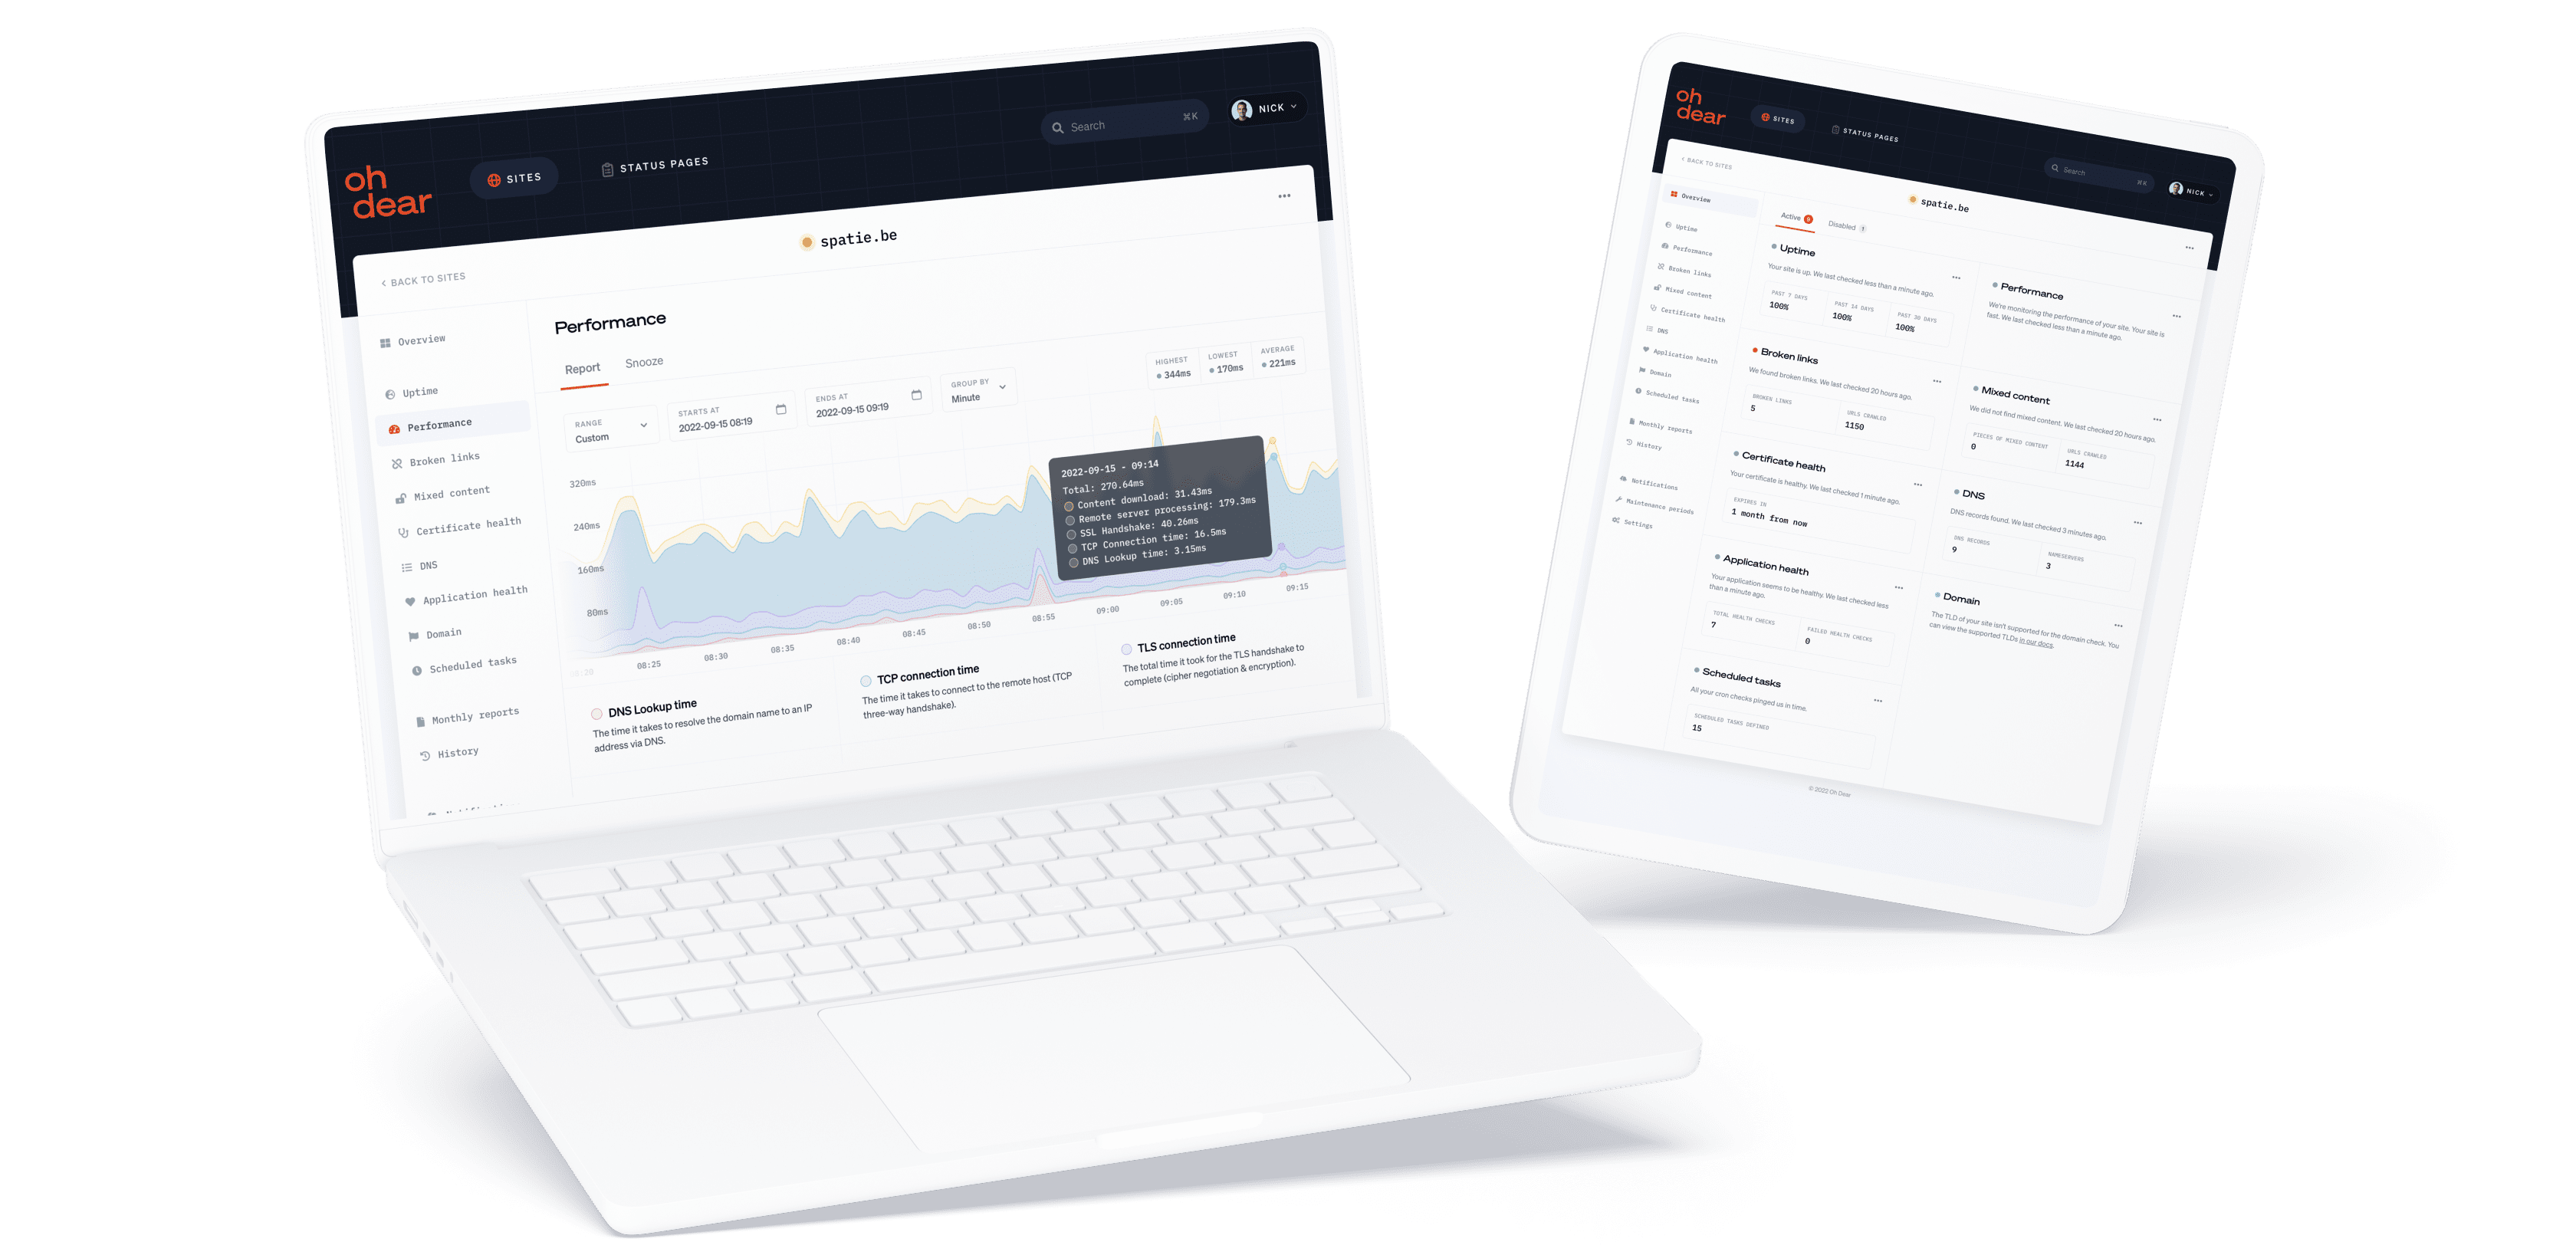
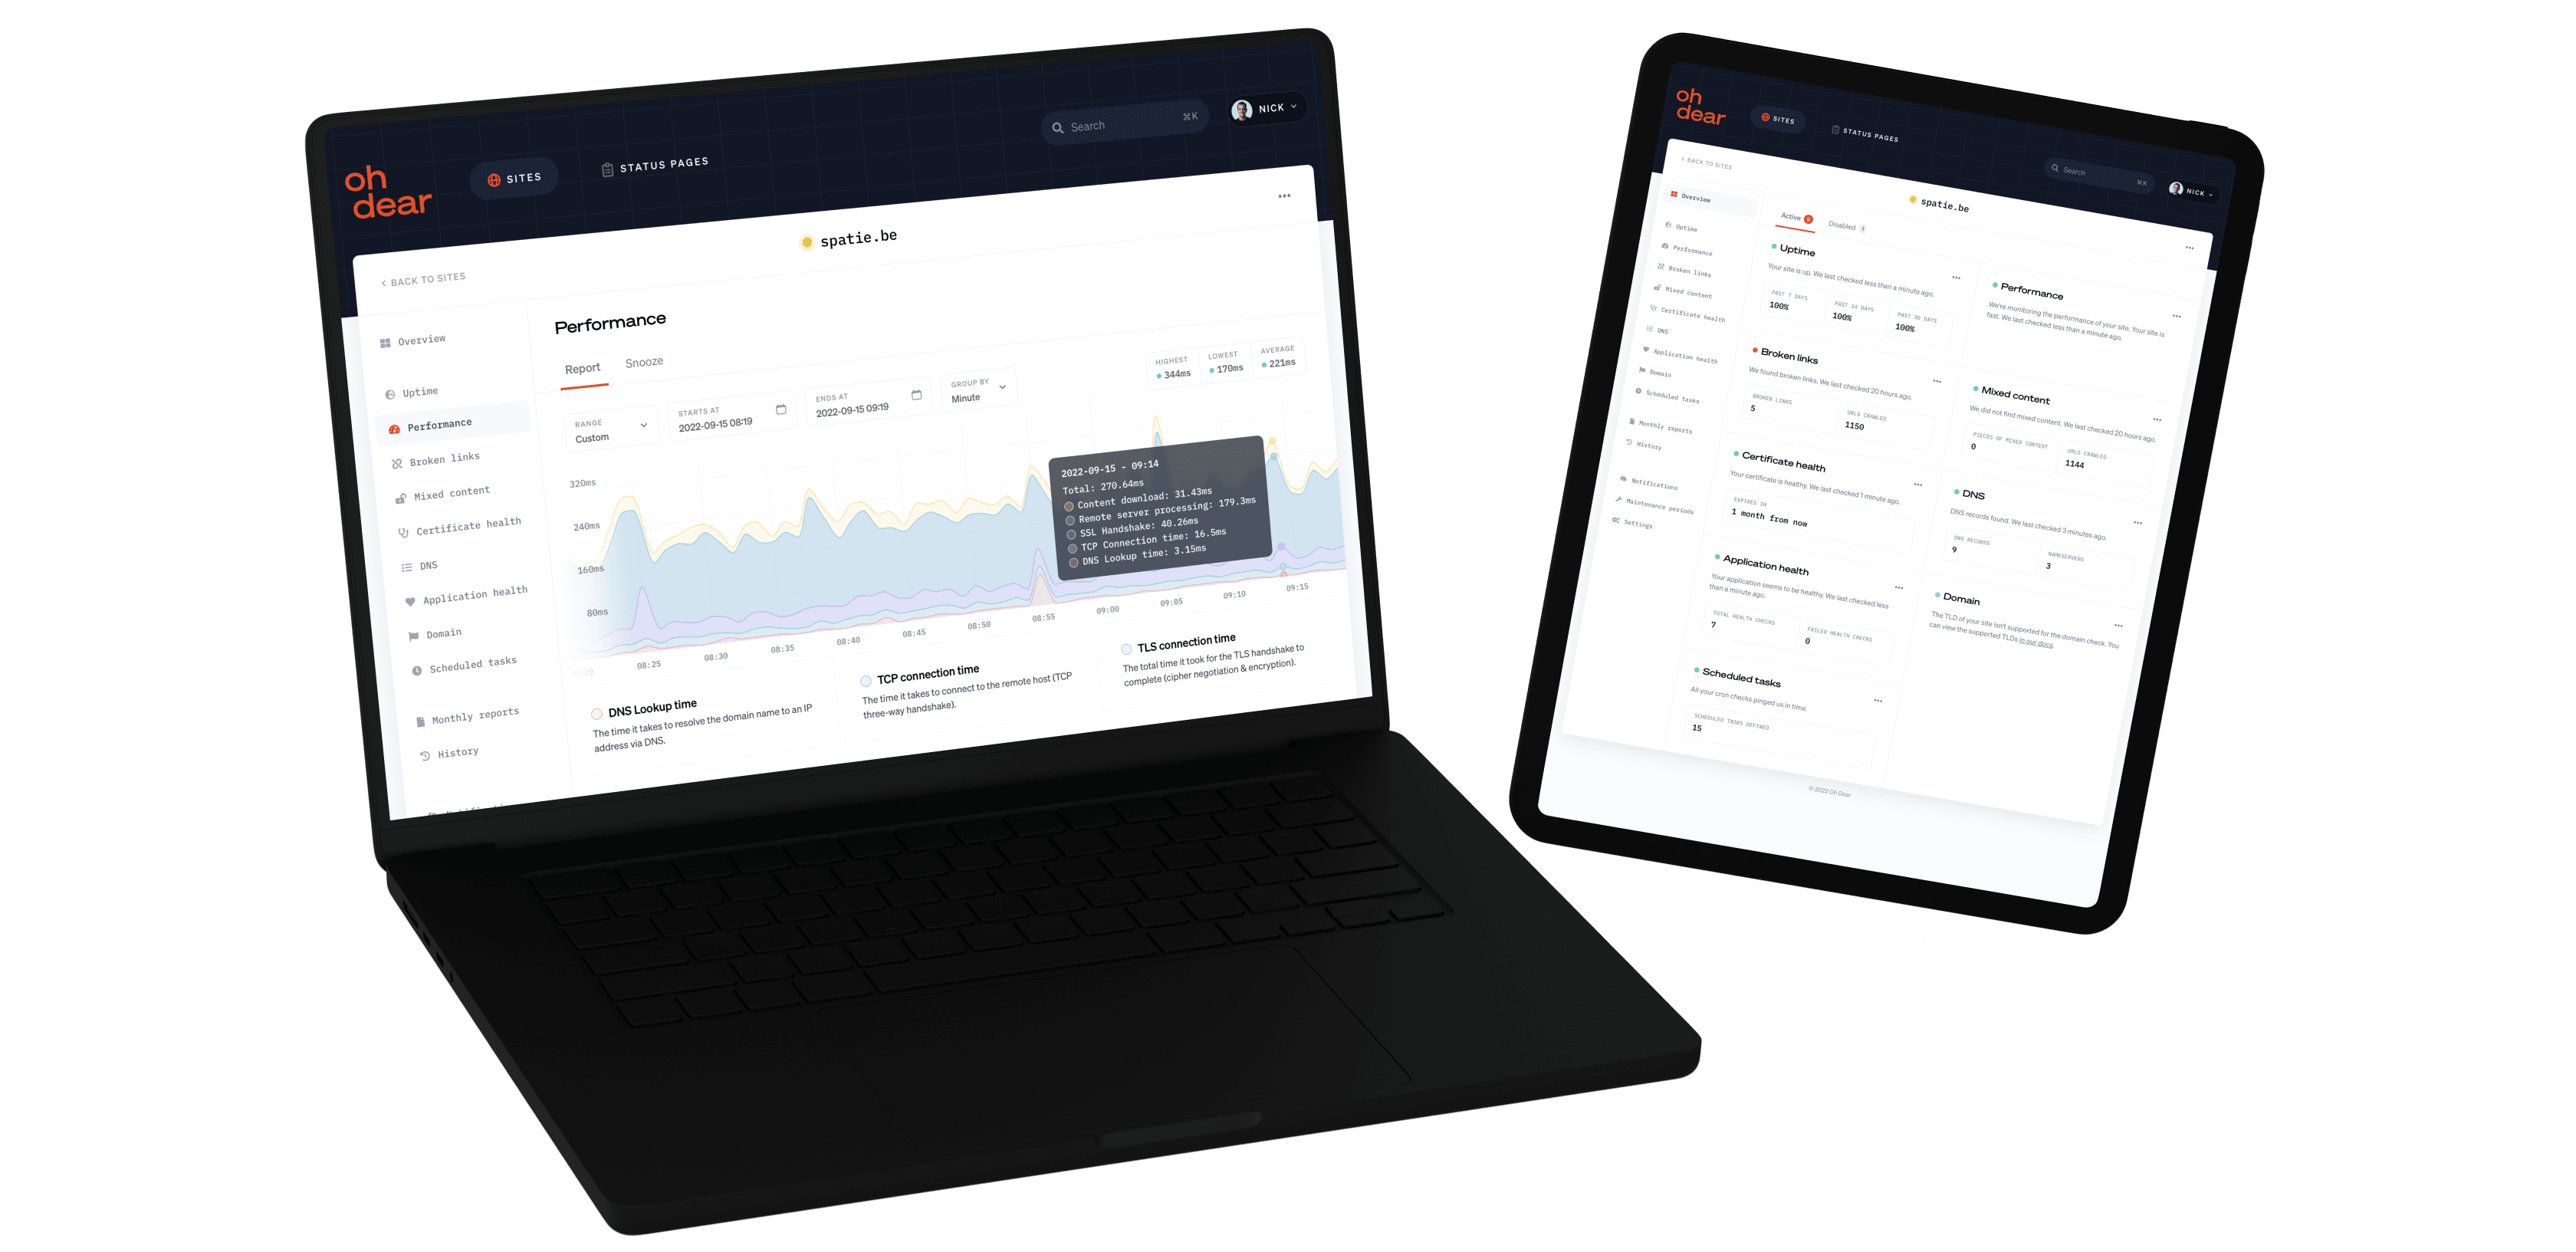
What does Oh Dear's performance monitoring measure?
It measures how long your pages take to respond, broken down into the phases that matter: DNS lookup, TCP connection, TLS handshake, the time your server spends building the response, and the download. When a page slows down, you can see which phase is to blame.
How often does Oh Dear check performance, and how long is the history kept?
Performance checks run every 15 minutes, and we keep a full year of history. That's enough to catch a slow Friday-afternoon deploy and to show the trend over months, not just today.
Will Oh Dear alert me when my site gets slow?
Yes, in two ways. Set a hard threshold (for example, alert me when responses pass 3.5 seconds), and we'll also flag a sudden slowdown by comparing the last 15 minutes against your recent baseline. So you hear about a real regression, not the usual noise.
Is this real-user monitoring (RUM)?
No, and we'd rather be straight about that. Oh Dear runs synthetic checks from our own servers, so monitoring keeps working even when nobody's visiting. For browser-level scores like SEO, accessibility, and best practices, that's our separate Lighthouse monitoring.
Why does my site's response time matter?
Because slow pages cost sales and rankings. A site that takes a few seconds longer to respond loses visitors before it even finishes loading. Watching response time means you fix the slowdown before it shows up in your conversion numbers.
Why do you need performance monitoring?
Because performance problems don't announce themselves. A slow database query, a third-party script timing out, an expired cache: none of them trip an uptime alert, they just drag the site down. Slow pages cost you users (bounce rates climb sharply as load time grows), rankings (Core Web Vitals are a ranking factor), and conversions. Oh Dear measures your pages' response time and alerts you when it crosses your threshold or deviates sharply from the recent baseline.
Wait, there's even more
API & endpoint monitoring
Call your endpoints every minute and validate what they actually return: status codes, response bodies, headers and response times. Webhooks and scheduled jobs included.
Continuous certificate monitoring
SSL certificates are essential in website security. We check all your certificate expiration dates & alert any change we detect.


Fast and insightful notifications
Get notified instantly as soon as we detect an issue or an important change. Enable any channel you use, you're in full control.
Scheduled task monitoring
Your cron jobs (Linux) and scheduled tasks (Windows) are the heart of your data processing. We can monitor every single one of them.


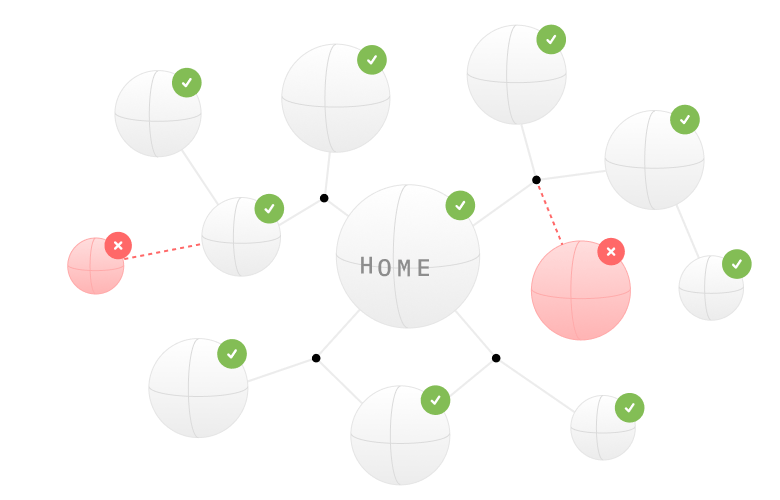
Broken page & mixed content
We crawl and index your entire website, just like Google. As soon as we detect a broken link on your site we will let you know.
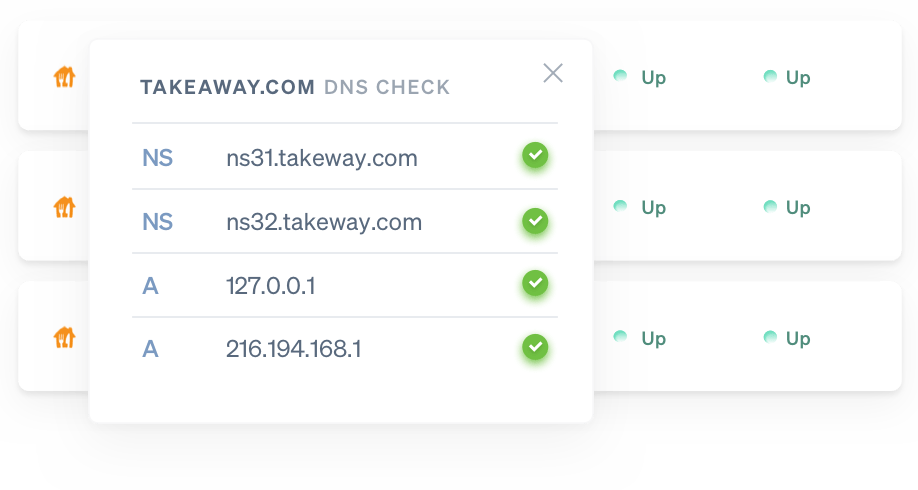
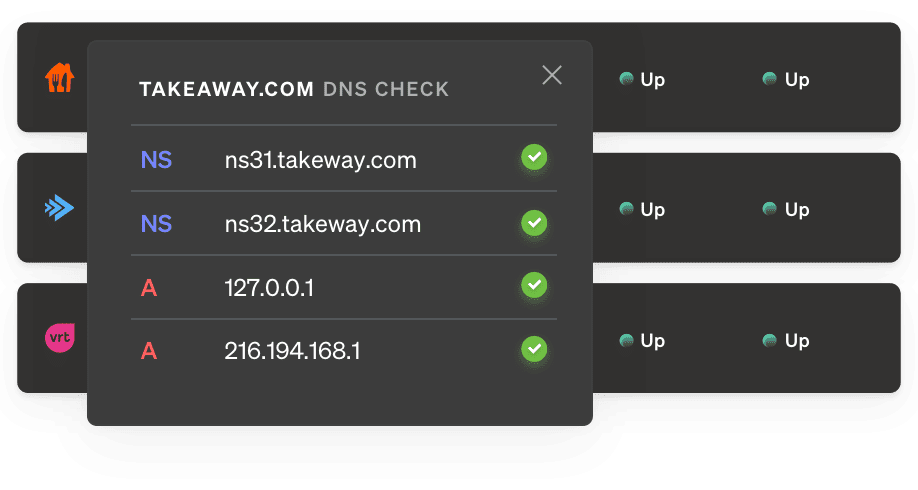
DNS record monitoring
Receive a notification whenever your DNS records are modified - intentionally or maliciously - so you can act and verify faster.
Application health monitoring
A lot can go wrong inside your app and server. Disk space may fill up, or the database may go down. We'll notify you when something is off.
Beautiful public status pages
In times of crisis, a public status page allows you to communicate to your clients. We'll host your status page so it's always available.
laravel.comign.comtakeaway.comWebsite uptime monitoring
When your website goes down we'll let you know instantly. Now you can act before your or your client's brand reputation takes a hit.
Domain monitoring
We can check how long your domain is still registered. If your renewal date is close, we'll notify you. This will avoid you losing your domain.
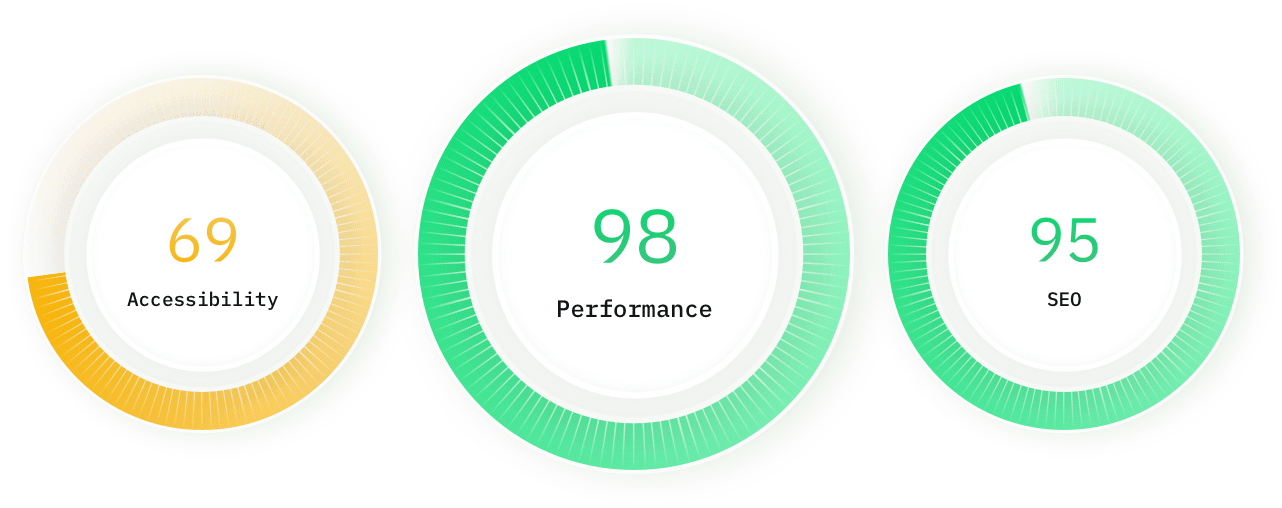
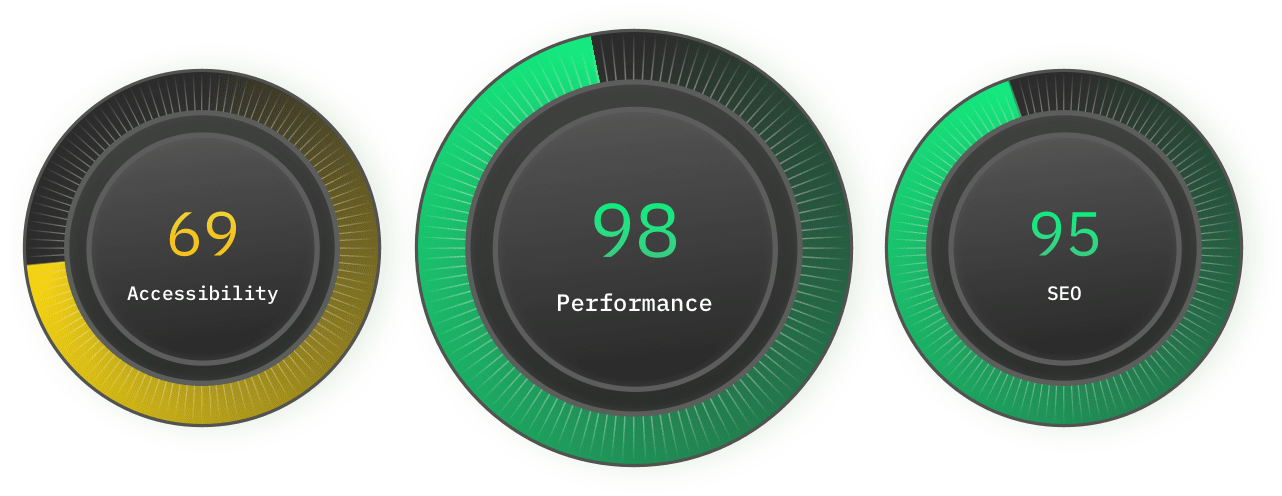
Lighthouse SEO monitoring
We track the speed & performance of your website over time. If we detect your website is suddenly slower, we'll let you know.
Sitemap monitoring
Elevate your SEO strategy and optimize your site. We analyse your sitemap health and check every URL for broken links.
Describe what you want to monitor
AI-powered monitoring
Use AI to verify anything you want on your websites and services with Oh Dear's AI-powered monitoring feature.
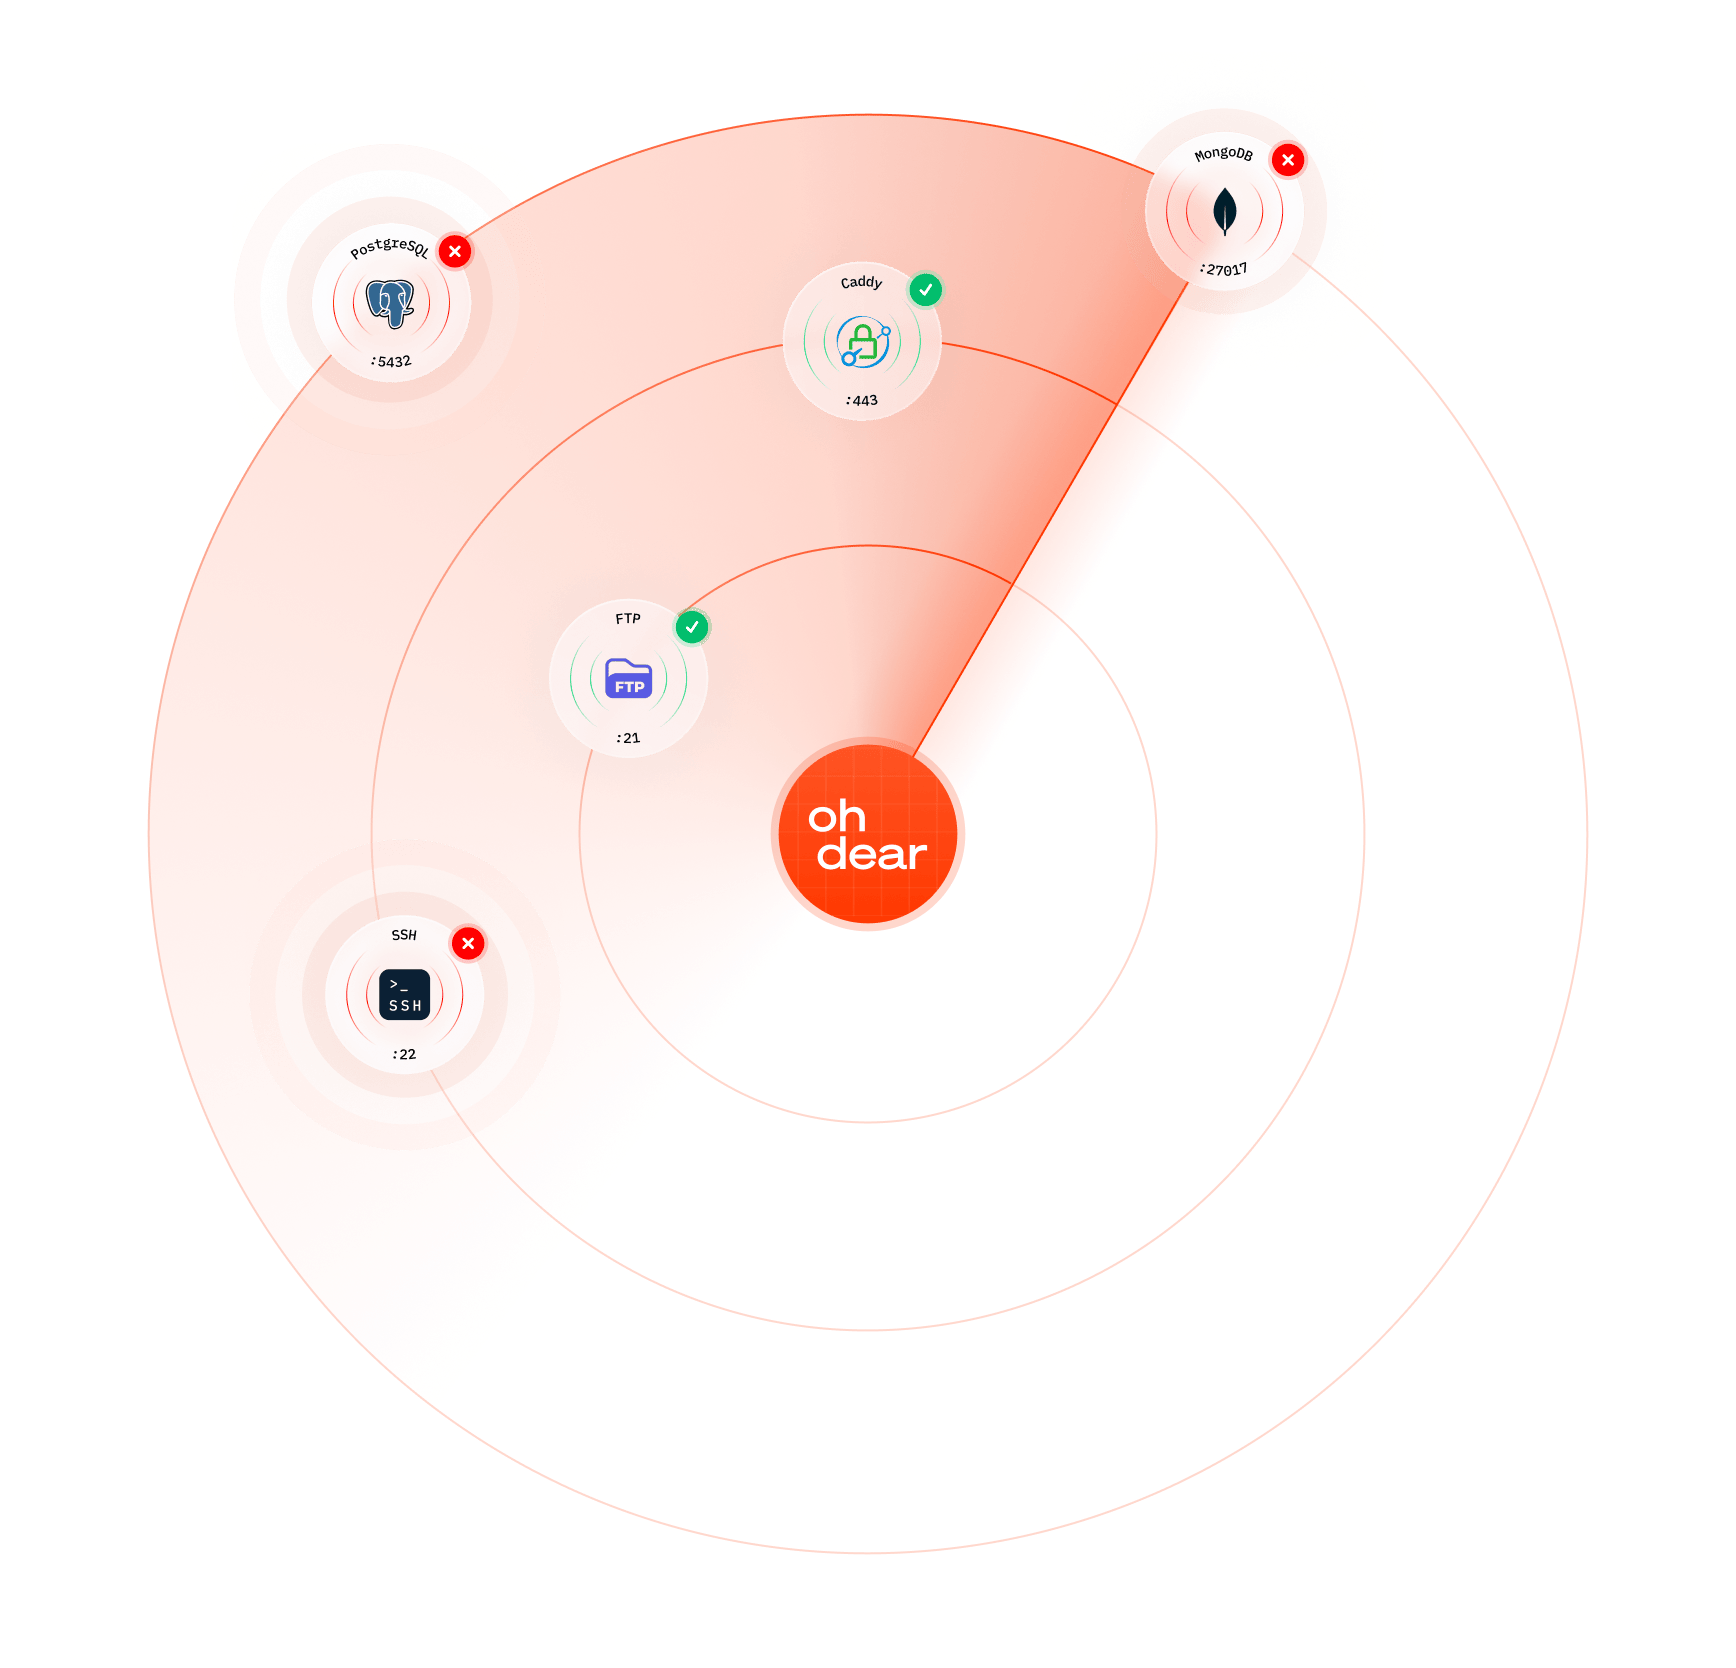
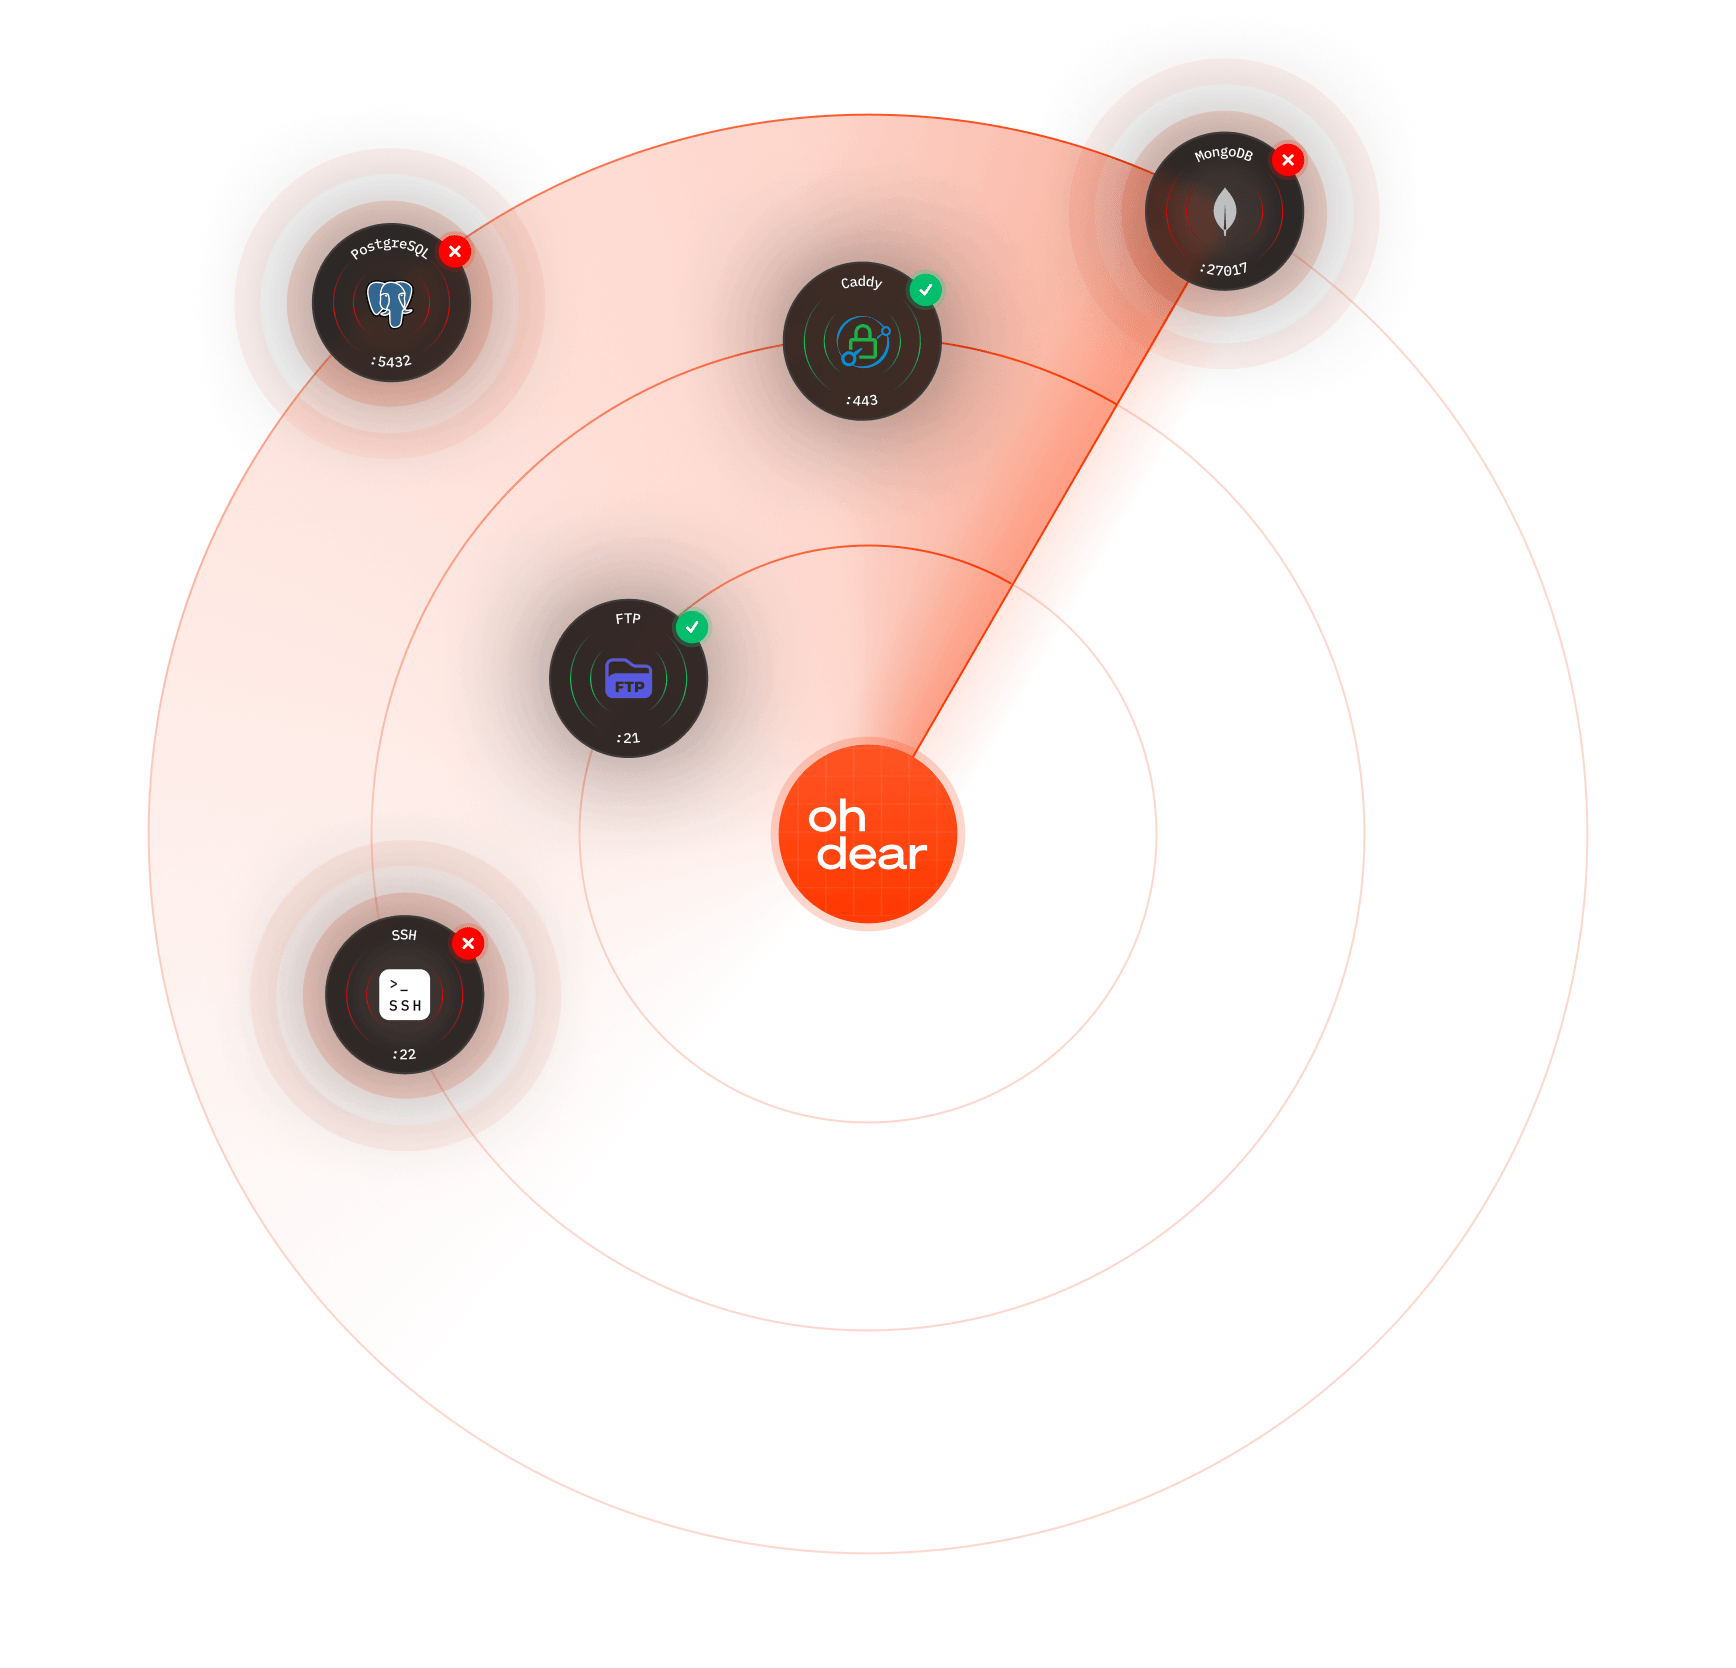
Port scanner
Define which ports should be open, and we scan all 65,535 ports on your server. Get alerted when expected ports go down or unexpected ports appear.
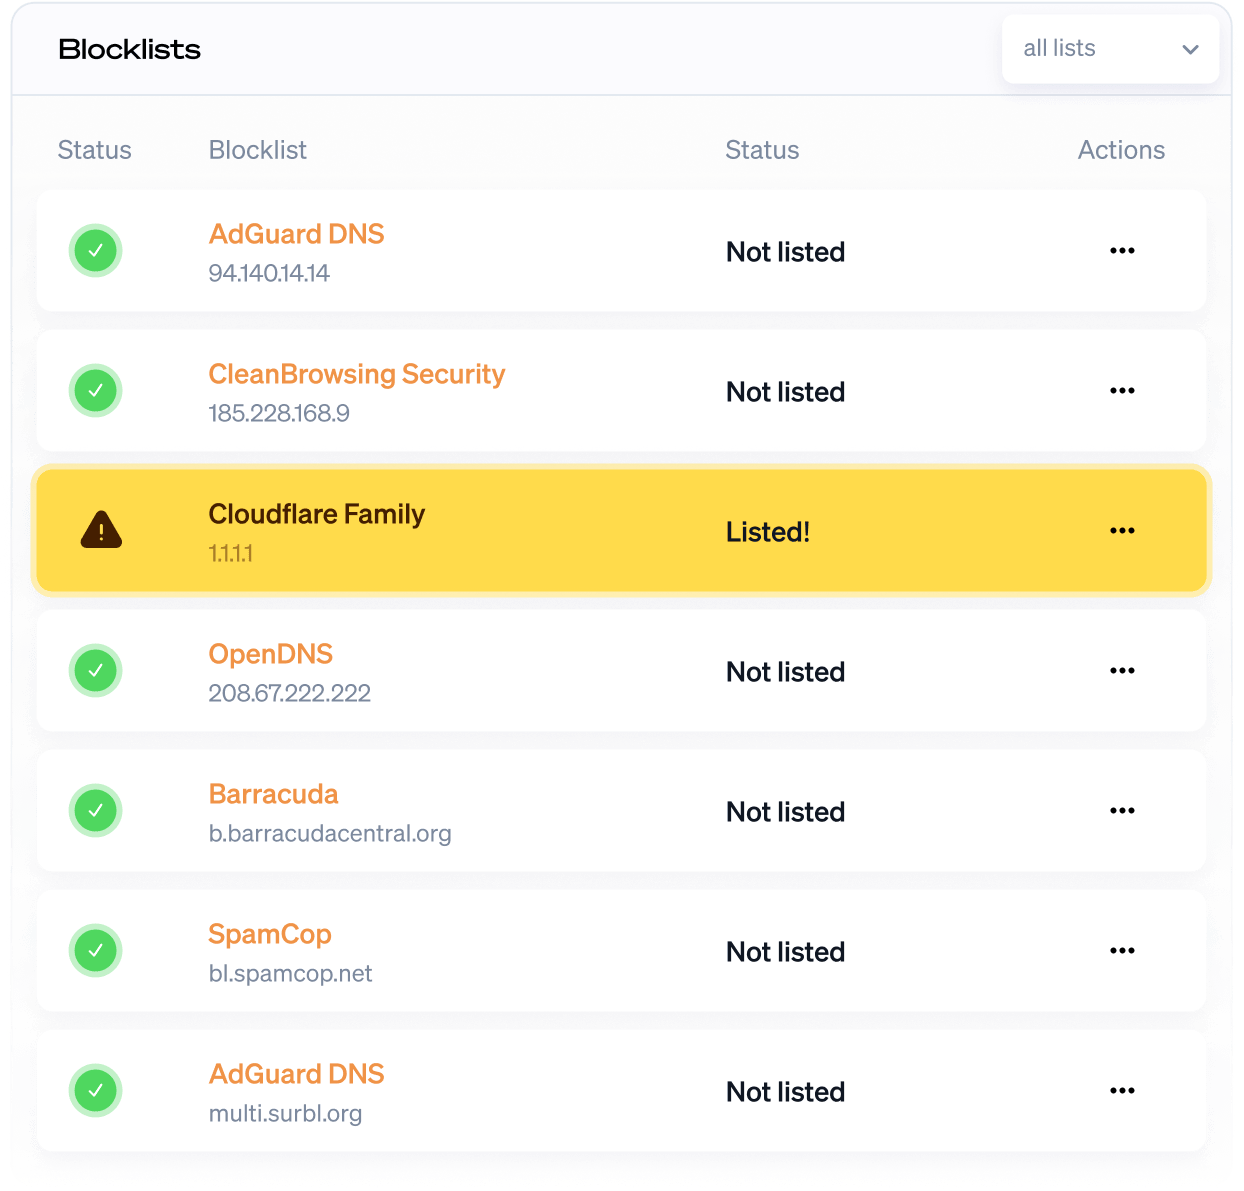
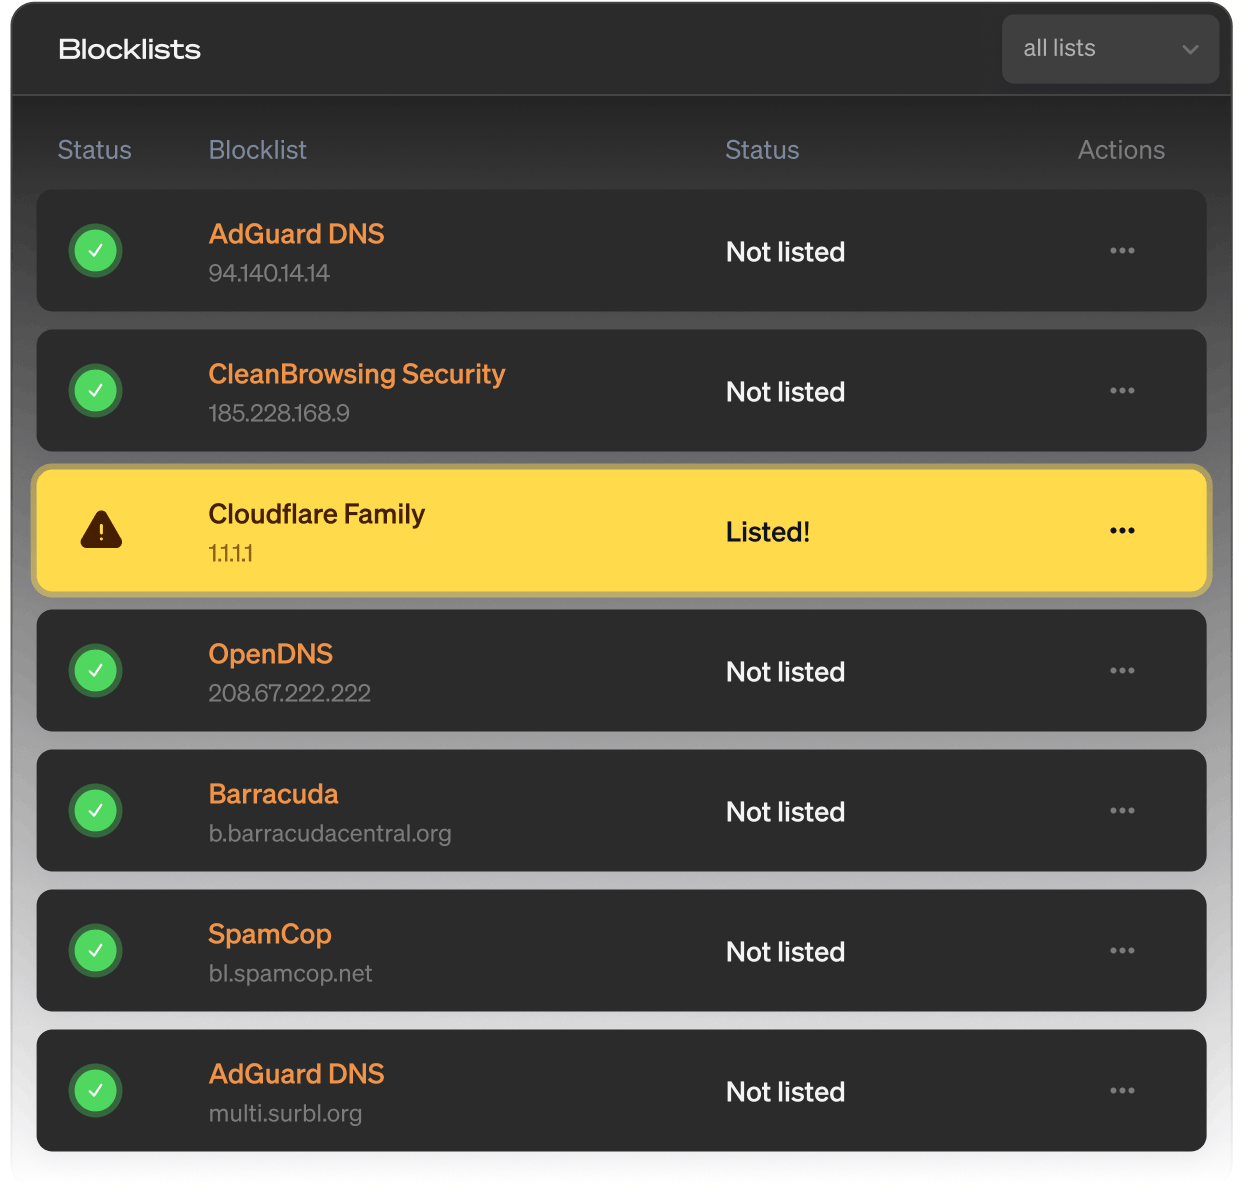
DNS blocklist monitoring
DNS blocklist monitoring helps you stay off spam and ad-block lists. Get notified when your DNS is blocked by a blacklist.
Single Sign-On (SSO)
Connect Oh Dear to your identity provider. Your team signs in with the credentials they already use.
GDPR & EU data residency
Oh Dear is a Belgian company. Your monitoring data is stored in the EU, with a signable DPA and a public subprocessor list.
Start monitoring instantly
Start a no-strings-attached 10-day free trial. You're all set in less than a minute. (No credit card needed.)
Not convinced yet? Need help? Get in touch via support@ohdear.app.