Docs/Integrations

The Oh Dear API

The Oh Dear API lets you configure everything about our application through a simple, structured Application Programming Interface (API).

Everything you see in your dashboard can be controlled with the API. And as a bonus, all changes you make with the API will be visible in realtime on your dashboard.

Oh Dear dashboard

Getting started

Let's help get you started.

  1. Learn about our API authentication and generate your first API key
  2. Retrieve a list of all your sites and their checks with the API.
  3. Configure your status pages automatically.

Optionally, we provide a PHP SDK package to help get you started.

API endpoints

All Oh Dear API endpoints are located at https://ohdear.app/api. From there on, you will find a logical structure that follows to the REST standard.

Here's a quick summary of the API methods.

  • GET: all GET requests are for data retrieval only (site listing, account info, ...) and will never modify any data.
  • POST: a POST method will add new sites or checks to Oh Dear
  • DELETE: the DELETE method is used to delete certain sites or checks from your account.
  • PUT: this method is used to update information on existing sites, checks or your account.

In general, GET requests can be performed as many times as you'd like (they are idempotent), all other methods actually transform data in your account and will cause changes to take effect.

Response data

All responses from the Oh Dear API will be formatted as JSON.

Here's an example payload of the /api/sites endpoint, that lists all sites.

{
  "data": [
    {
      "id": 1,
      "url": "https://yoursite.tld",
      ...
    },
    {
      "id": 2,
      "url": "https://yourothersite.tld",
      ...
    }
  ]
}

Each endpoint will return specific data for that request. More info on that in the sites and checks pages.

Get your API token

Once you are logged in to your dashboard navigate to API access and create your API token.

You can name your token, so you know where this one is going to be used, in case you ever need to revoke it.

Oh Dear API access

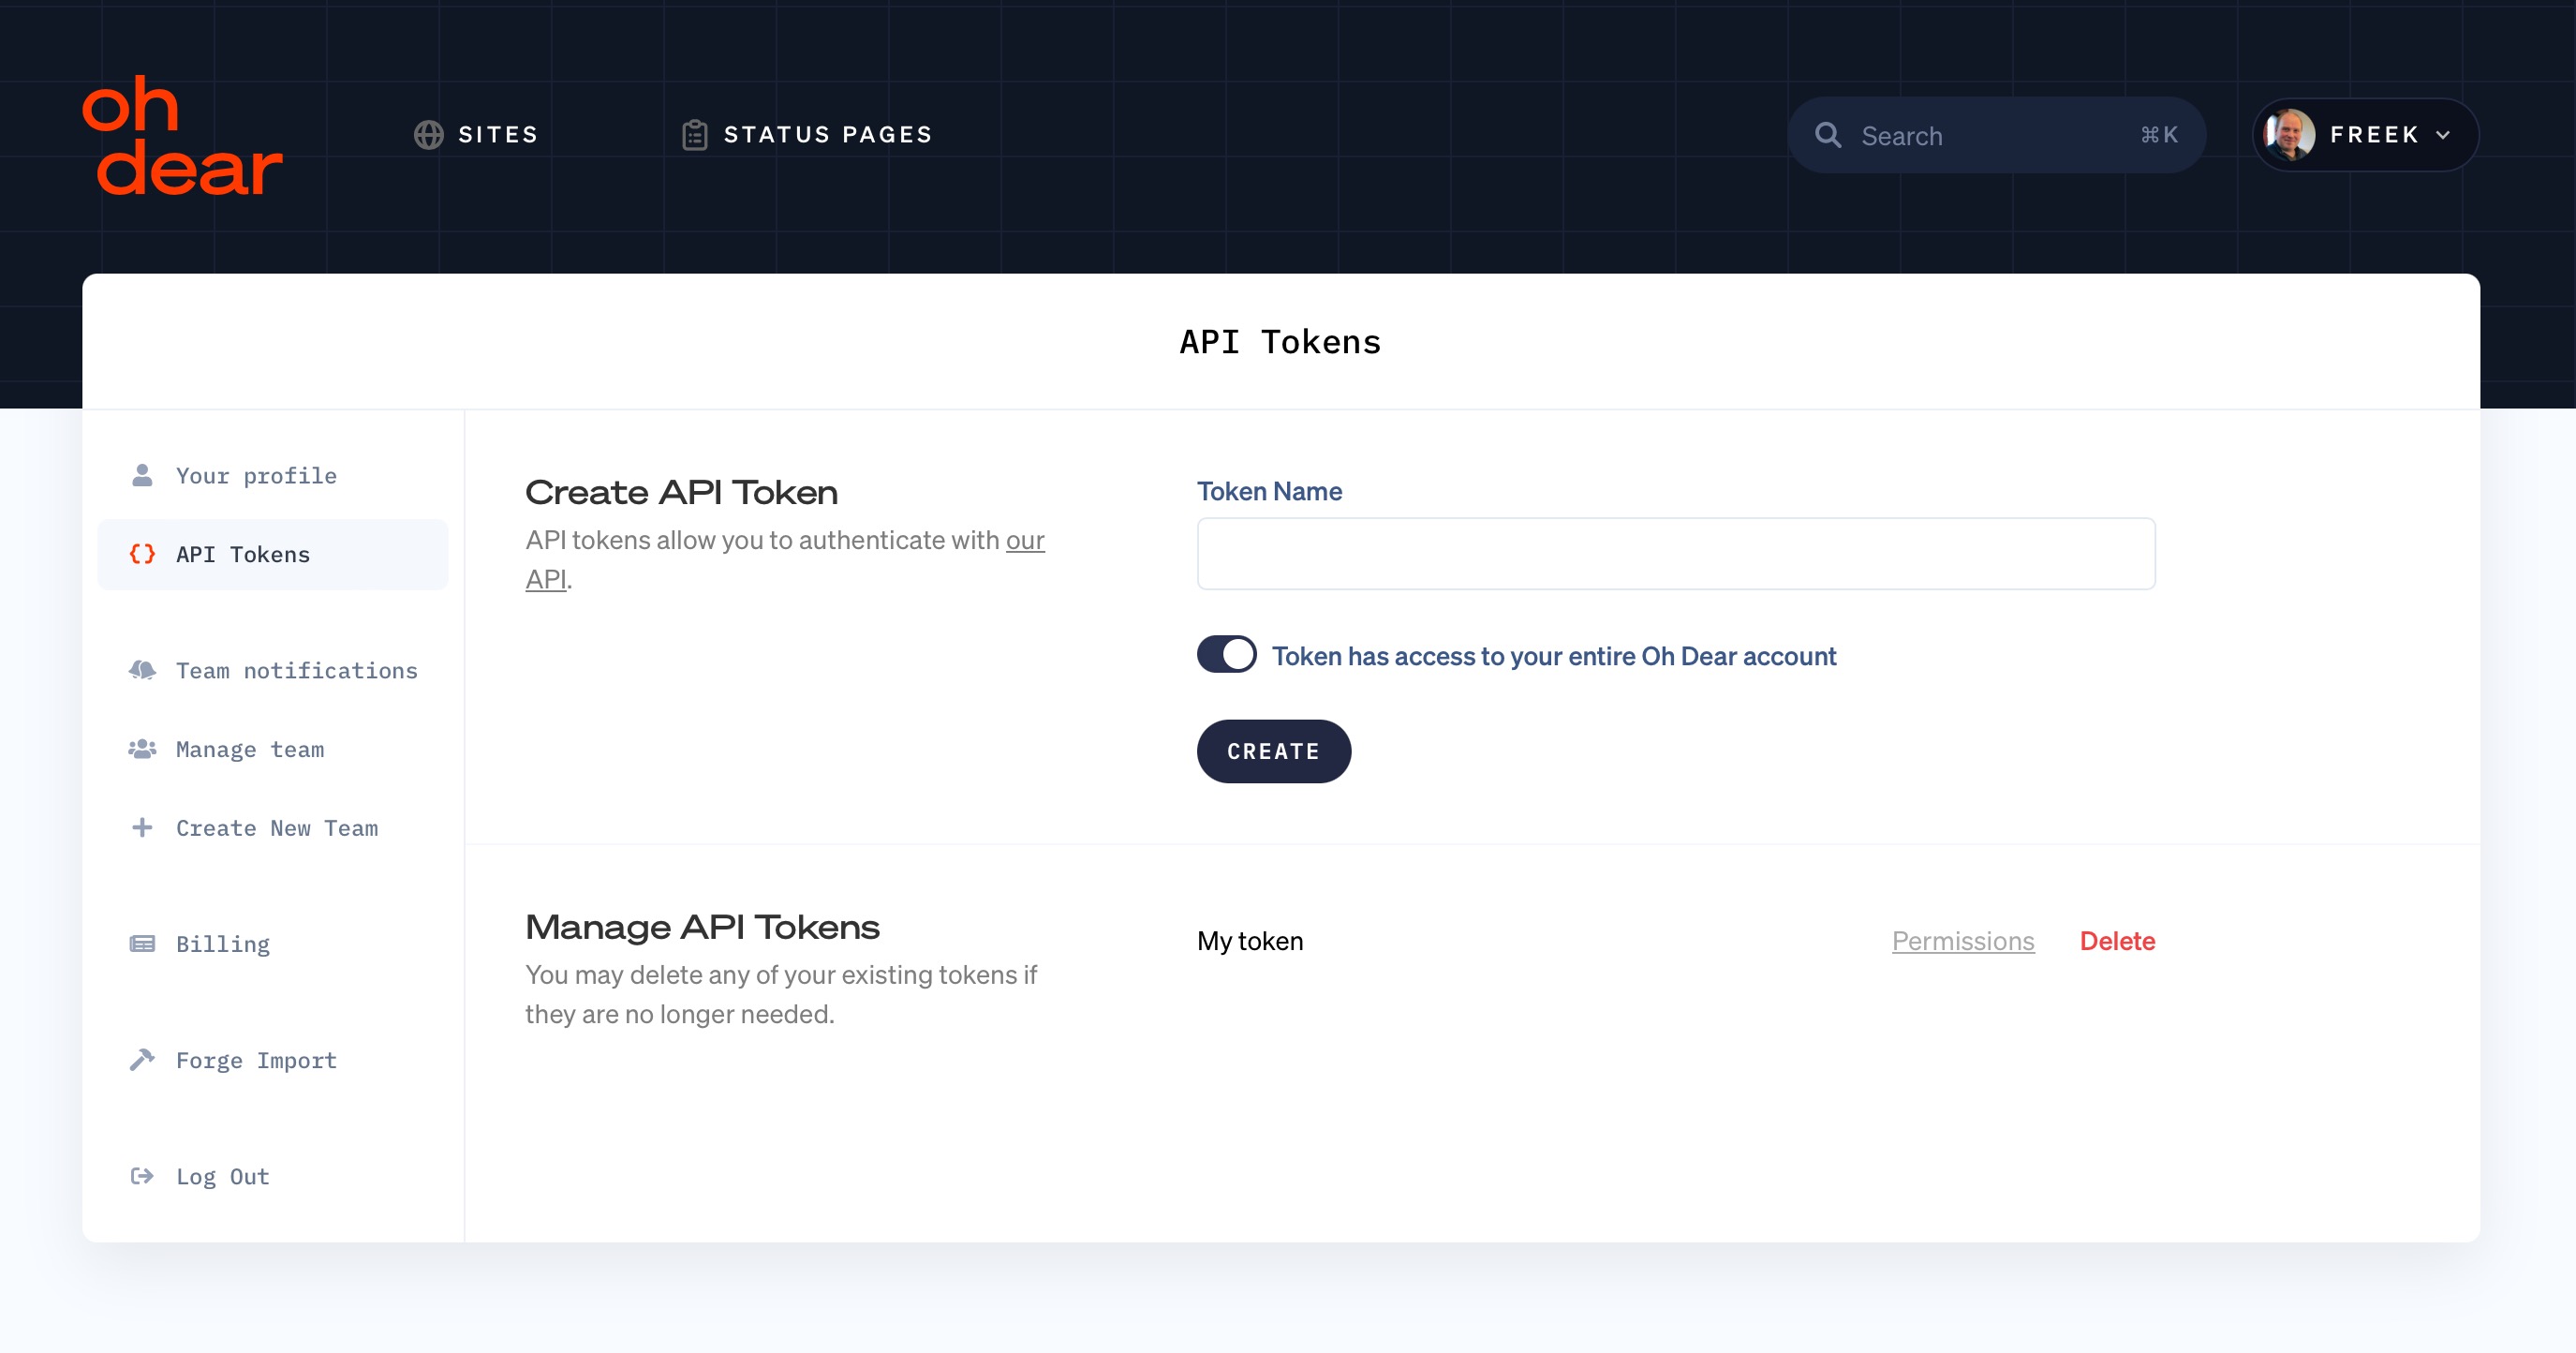
Once you create a token, it'll be shown only once to you. Make sure to store it safely, after this it can only be revoked and you can generate a new token for use.

Once you have your token, you can authenticate against the application.

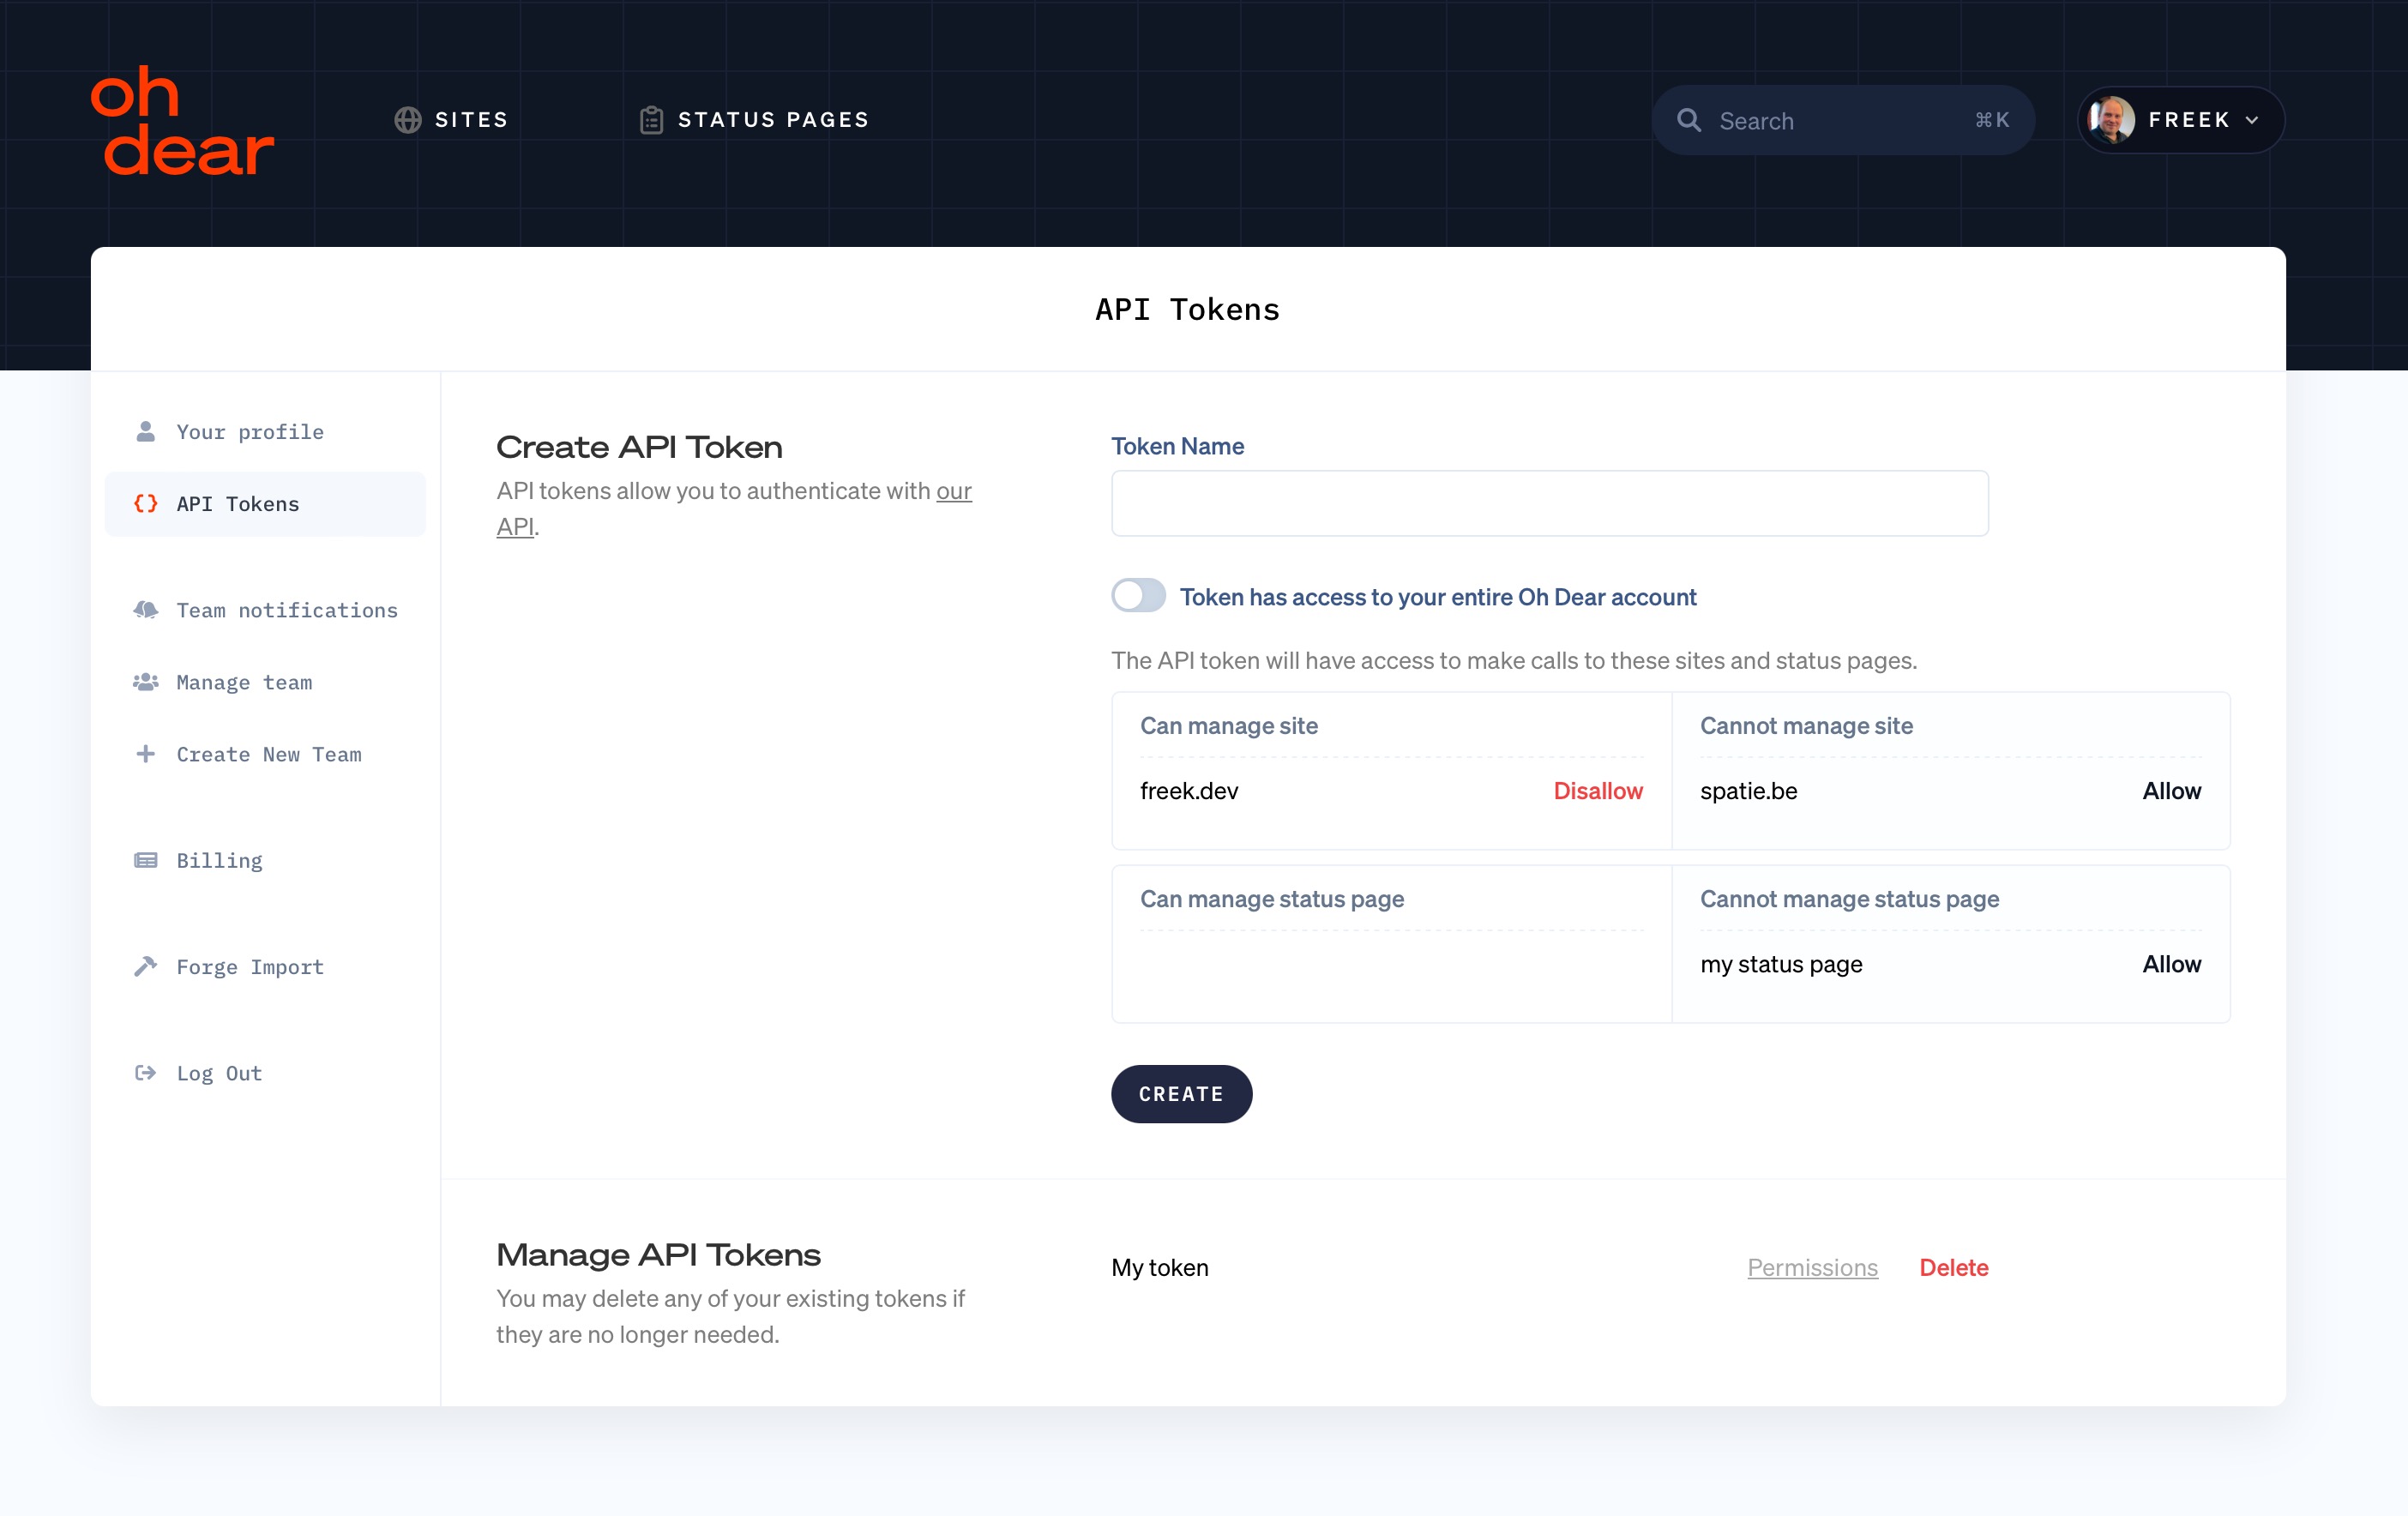
By default, tokens can perform any actions to everything in your Oh Dear account. You can also create API tokens that only can be used in API calls to a selection of sites and status pages.

Oh Dear API scoped_token

Authenticate against the API

The token you've received can be used as the Authorization header.

Here's a curl example of how you can authenticate against the API. In this example, it'll list all sites in your account.

$ OHDEAR_TOKEN="your API token"
$ curl https://ohdear.app/api/sites \
    -H "Authorization: Bearer $OHDEAR_TOKEN" \
    -H 'Accept: application/json' \
    -H 'Content-Type: application/json'

The token bgUKSWYL30iHg5w0WTDGHfubt5L1HBTr0atAehCeSqwNTqkU9rOmsNEmWf6Y is used to authenticate. The /api/sites endpoint is hit to retrieve all sites. The resulting response payload may look like this.

{
  "data": [
    {
      "id": 1,
      "url": "https://yoursite.tld",
      ...
    },
    {
      "id": 2,
      "url": "https://yourothersite.tld",
      ...
    }
  ]
}

The actual payload is usually much bigger, but that's described in more detail in the sites and checks page.

Sites

Get all sites in your account

The /api/sites endpoint lists all your sites in your account.

$ OHDEAR_TOKEN="your API token"
$ curl https://ohdear.app/api/sites \
    -H "Authorization: Bearer $OHDEAR_TOKEN" \
    -H 'Accept: application/json' \
    -H 'Content-Type: application/json'

As a result, you get the details for every site you've added.

{
    "data": [
        {
            "id": 1,
            "url": "http://yoursite.tld",
            "sort_url": "yoursite.tld",
            "label": "your-site",
            "team_id": 1,
            "group_name": null,
            "tags": ["tag a", "tag b"],
            "notes": "custom notes",
            "latest_run_date": "2019-09-16 07:29:02",
            "summarized_check_result": "succeeded",
            "created_at": "20171106 07:40:49",
            "updated_at": "20171106 07:40:49",
            "checks": [
                {
                    "id": 100,
                    "type": "uptime",
                    "label": "Uptime",
                    "enabled": true,
                    "latest_run_ended_at": "2019-09-16 07:29:02",
                    "latest_run_result": "succeeded",
                    "summary": "Up"
                },
                {
                    "id": 101,
                    "type": "broken_links",
                    "label": "Broken links",
                    "enabled": true,
                    "latest_run_ended_at": "2019-09-16 07:29:05",
                    "latest_run_result": "succeeded",
                    "summary": ""
                }
            ]
        },
        {
            "id": 2,
            "url": "https://yourothersite.tld",
            "sort_url": "yourothersite.tld",
            "label": "my-site",
            "team_id": 1,
            "group_name": "My group",
            "tags": [],
            "notes": "",
            "latest_run_date": "2019-09-16 07:29:02",
            "summarized_check_result": "failed",
            "created_at": "20171108 07:40:16",
            "updated_at": "20171108 07:40:16",
            "checks": [
                {
                    "id": 1,
                    "type": "uptime",
                    "label": "Uptime",
                    "enabled": true,
                    "latest_run_ended_at": "2019-09-16 07:29:02",
                    "latest_run_result": "succeeded",
                    "summary": "up"
                },
                {
                    "id": 2,
                    "type": "broken_links",
                    "label": "Broken links",
                    "enabled": true,
                    "latest_run_ended_at": "2019-09-16 07:29:05",
                    "latest_run_result": "failed",
                    "summary": "1 found"
                },
                {
                    "id": 3,
                    "type": "mixed_content",
                    "label": "Mixed content",
                    "enabled": true,
                    "latest_run_ended_at": "2019-09-16 07:29:05",
                    "latest_run_result": "succeeded",
                    "Summary": ""
                },
                {
                    "id": 4,
                    "type": "certificate_health",
                    "label": "Certificate health",
                    "enabled": true,
                    "latest_run_ended_at": "2019-09-16 07:29:02",
                    "latest_run_result": "failed",
                    "Summary": "Problems detected"
                },
                {
                    "id": 5,
                    "type": "certificate_transparency",
                    "label": "Certificate transparency",
                    "enabled": true,
                    "latest_run_ended_at": null,
                    "latest_run_result": null,
                    "summary": null
                }
            ]
        }
    ]
}

Let's drill this down, because the 2 sites that are listed each have different checks.

The first one is an http:// site, without TLS encryption. Since we can't monitor certificates or mixed content, we only check the uptime of the site and the broken links.

That's why there are only 2 checks item for that site.

The second site is an https:// site, and it gets all the available monitoring. More on each check in our dedicated checks page.

Get a specific site via the API

If you don't want to retrieve all sites, you can get a specific site if you know its ID. The example below will get the details of site ID 99.

$ OHDEAR_TOKEN="your API token"
$ curl https://ohdear.app/api/sites/99 \
    -H "Authorization: Bearer $OHDEAR_TOKEN" \
    -H 'Accept: application/json' \
    -H 'Content-Type: application/json'

The resulting pageload of both calls above is a single site.

{
  "id": 99,
  "url": "http://yoursite.tld",
  "sort_url": "yoursite.tld",
  ...
  "checks": [
    {
      ...
    },
    ...
  ]
}

Notice how this payload does not contain the data block (the API call to retrieve all sites does).

Return properties

The response gives you a lot of details per site. Here's the specifics;

  • id: an internal identifier to Oh Dear
  • url: the URL you used to submit this site to Oh Dear, including the protocol.
  • sort_url: the url without the protocol and without the www. prefix.
  • friendly_name: the friendly name of a site
  • label: contains the friendly_name if one is specified, otherwise this contains the sort_url.
  • team_id: every site belongs to a Team, this is its ID. A team can consist of multiple members (including yourself). Since you can belong to multiple teams, the corresponding team ID will be shown for every site. To know which team this is, have a look at the user info API call.
  • group_name: the name of the group your site belongs to
  • tags: the names of the tags associated with your site
  • latest_run_date: the date & time of the last time one of the checks in this site has run.
  • summarized_check_result: this gives you an overview of the health of your site at a glance. Possible values are succeeded, warning or failed. To get the details of the status, you'll have to check the output of each check.
  • uses_https: whether it has an https:// prefix.
  • checks: an array of all checks that have been added to this site. More details on the checks page.
  • broken_links_check_include_external_links: boolean, whether the crawler will check for external links or not.
  • broken_links_whitelisted_urls: array of ignored URLs that should not be reported if they contain broken links.
  • created_at and update_at: timestamp values for when it was created and when the site's properties were last updated.

More properties will be added over time.

Getting a summary of the results of a check

Oh Dear can perform various checks (uptime, mixed content, broken links, ...) for your sites.

If you want to know the status of a particular check, you can query the /api/sites/{siteId}/check-summary/{checkType} endpoint.

The checkType segment can be one of the following values:

  • uptime
  • performance
  • certificate_health
  • broken_links
  • mixed_content
  • lighthouse
  • cron
  • application_health
  • dns
  • domain
  • certificate_transparency

Here's an example:

$ OHDEAR_TOKEN="your API token"
$ curl https://ohdear.app/api/sites/99/check-summary/uptime \
    -H "Authorization: Bearer $OHDEAR_TOKEN" \
    -H 'Accept: application/json' \
    -H 'Content-Type: application/json'

The response holds two properties:

  • result: this is the result of the check. Possible values are pending, succeeded, warning, failed or errored-or-timed-out.
  • summary: a human-readable summary of the check result

Add a site through the API

To add a site, create a POST call to the /api/sites/ endpoint. Here's an example to add the site https://mybrandnewsite.tld to Oh Dear.

$ OHDEAR_TOKEN="your API token"
$ curl -X POST https://ohdear.app/api/sites \
    -H "Authorization: Bearer $OHDEAR_TOKEN" \
    -H 'Accept: application/json' \
    -H 'Content-Type: application/json' \
    -d '{"url":"https://mybrandnewsite.tld", "team_id":"1"}'

Remember that we love JSON? Your request payload should also be valid JSON. The actual payload, when formatted, looks like this.

{
    "url": "https://mybrandnewsite.tld",
    "team_id": "1"
}

Mandatory fields are the url we should monitor and the team_id where this site should be added to. To find out the teams you belong to, see the user info API call.

If the API call succeeded, you'll be given output like this, showcasing every check that was added.

{
  "id": 173,
  "url": "https://mybrandnewsite.tld",
  "sort_url": "mybrandnewsite.tld",
  "team_id": 1,
  ...
  "checks": [
    {
      "id": 560,
      "type": "certificate_health",
      "enabled": true
    },
    {
      "id": 561,
      "type": "mixed_content",
      "enabled": true
    },
    ...
  ]
}

When creating a site you can control which checks get enabled. You can do so by passing an array with one of these check types:

  • uptime
  • broken_links
  • mixed_content
  • certificate_health
  • certificate_transparency.

Here's an example payload where a site is created with only the uptime and mixed_content checks enabled.

{
    "url": "https://mybrandnewsite.tld",
    "team_id": "1",
    "checks": ["uptime", "mixed_content"]
}

For more details on each check, have a look at the checks API endpoint.

Error handling

If an error occurred, you'll be given a non-HTTP/200 response code. The resulting payload might look like this.

{
    "message": "The given data was invalid.",
    "errors": {
        "url": ["The url field is required."],
        "team_id": ["The team id field is required."]
    }
}

If you've got both the url and the team_id in your payload, but the data is invalid, you'll get a detailed error message.

{
    "message": "The given data was invalid.",
    "errors": {
        "url": ["You should enter a url that starts with either \"http://\" or \"https://\"."],
        "team_id": ["You do not belong to that team."]
    }
}

Deleting a site

Use the DELETE method to delete a site through the API. In this example, we'll delete the site with ID 1.

$ OHDEAR_TOKEN="your API token"
$ curl -X DELETE https://ohdear.app/api/sites/1 \
    -H "Authorization: Bearer $OHDEAR_TOKEN" \
    -H 'Accept: application/json' \
    -H 'Content-Type: application/json'

Notice how we're calling the DELETE method on the /api/sites/1 endpoint. The 1 in the URL determines which site to delete.

You can add a single URL to our crawler ignore list with an easy API method. This is primarily used to quickly add just a single URL, for instance in an overview-screen where you allow users to whitelist URLs.

If you want to ignore several URLs, or remove ignored URLs, please see the more extended update-broken-links-settings API call.

$ OHDEAR_TOKEN="your API token"
$ curl -X POST https://ohdear.app/api/sites/1/add-to-broken-links-whitelist \
    -H "Authorization: Bearer $OHDEAR_TOKEN" \
    -H 'Accept: application/json' \
    -H 'Content-Type: application/json' \
    -d '{
          "whitelistUrl": "https://externalsite.tld/page1"
        }'

Modifying site settings

You can control whether our crawler should check for external links or stick to internal pages only.

Additionally, you can update the site settings and ignore URLs that are known to be broken (or out of your control), so we no longer report if we find broken pages listed on them.

Note: this lists the source URLs, not the destinations.

$ OHDEAR_TOKEN="your API token"
$ curl -X PUT https://ohdear.app/api/sites/1/update-broken-links-settings \
    -H "Authorization: Bearer $OHDEAR_TOKEN" \
    -H 'Accept: application/json' \
    -H 'Content-Type: application/json' \
    -d '{
          "broken_links_check_include_external_links": true,
          "broken_links_whitelisted_urls_string":"
https://externalsite.tld/page1
https://externalsite.tld/page2"
        }'

The inputs are as follows:

  • broken_links_check_include_external_links: boolean value, either true or false
  • broken_links_whitelisted_urls_string: string value, new-line separated list of fully qualified URLs that we should ignore and not report on

Both can be used independently, if you just want to update the broken_links_check_include_external_links setting, there is no need to also submit the list of ignored URLs.

Updating HTTP client request headers

When performing the uptime, mixed content and broken links checks, Oh Dear can add extra headers to each request we make to a site.

You can update used headers by performing this PUT request:

$ OHDEAR_TOKEN="your API token"
$ curl -X PUT https://ohdear.app/api/sites/1/update-http-client-headers \
    -H "Authorization: Bearer $OHDEAR_TOKEN" \
    -H 'Accept: application/json' \
    -H 'Content-Type: application/json' \
    -d '[
          {"name": "my-header", "value": "value-of-header"}
        ]'

Updating the uptime check payload

Oh Dear can send form data along with the uptime check for all non-GET requests.

You can update the sent payload by performing this PUT request:

$ OHDEAR_TOKEN="your API token"
$ curl -X PUT https://ohdear.app/api/sites/1/update-uptime-check-payload \
    -H "Authorization: Bearer $OHDEAR_TOKEN" \
    -H 'Accept: application/json' \
    -H 'Content-Type: application/json' \
    -d '[
          {"name": "my-name", "value": "my-value"}
        ]'

Checks

Get all checks for a particular site

To know what checks are available to you, you'll need to query the sites API call first. Per site, you'll be given a set of check IDs.

In this example, we'll get the details for site ID 99. Notice the checks data attribute.

$ OHDEAR_TOKEN="your API token"
$ curl https://ohdear.app/api/sites/99 \
    -H "Authorization: Bearer $OHDEAR_TOKEN" \
    -H 'Accept: application/json' \
    -H 'Content-Type: application/json'

Here's the response:

{
  "id": 1,
  "url": "https://yoursite.tld",
  ...
  "checks": [
    {
      "id": 1,
      "type": "uptime",
      "label": "Uptime",
      "enabled": true,
      "latest_run_ended_at": "2019-09-16 07:29:02",
      "latest_run_result": "succeeded"
    },
    {
      "id": 2,
      "type": "broken_links",
      "label": "Broken links",
      "enabled": true,
      "latest_run_ended_at": "2019-09-16 07:29:05",
      "latest_run_result": "failed"
    },
    {
      "id": 3,
      "type": "mixed_content",
      "label": "Mixed content",
      "enabled": true,
      "latest_run_ended_at": "2019-09-16 07:29:05",
      "latest_run_result": "succeeded"
    },
    {
      "id": 4,
      "type": "certificate_health",
      "label": "Certificate health",
      "enabled": true,
      "latest_run_ended_at": "2019-09-16 07:29:02",
      "latest_run_result": "succeeded"
    },
    {
      "id": 5,
      "type": "certificate_transparency",
      "label": "Certificate transparency",
      "enabled": true,
      "latest_run_ended_at": "2019-09-16 07:29:02",
      "latest_run_result": "succeeded"
    }
  ],
}

Per check, you'll see its id. Once you know that ID, you can enable or disable that check or request a new run, on the spot.

Enable & disable a check

Let's take the first check ID, 1, as an example. First, we'll enable the check.

$ OHDEAR_TOKEN="your API token"
$ curl -X POST https://ohdear.app/api/checks/1/enable \
    -H "Authorization: Bearer $OHDEAR_TOKEN" \
    -H 'Accept: application/json' \
    -H 'Content-Type: application/json'

You make a POST call to /api/checks/{id}/enable to enable that check. As a result, you'll be given a confirmation payload.

{
    "id": 405,
    "type": "uptime",
    "enabled": true
}

To disable, make a similar POST to the /disable endpoint.

$ OHDEAR_TOKEN="your API token"
$ curl -X POST https://ohdear.app/api/checks/1/disable \
    -H "Authorization: Bearer $OHDEAR_TOKEN" \
    -H 'Accept: application/json' \
    -H 'Content-Type: application/json'

The resulting payload will confirm the enabled attribute is set to false.

{
    "id": 405,
    "type": "uptime",
    "enabled": false
}

From that point forward, we'll no longer run that particular check.

If you want to trigger an on-demand run of a check, for instance a new mixed content or broken links scan, you can send an API call to the /request-run endpoint.

$ OHDEAR_TOKEN="your API token"
$ curl -X POST https://ohdear.app/api/checks/1/request-run \
    -H "Authorization: Bearer $OHDEAR_TOKEN" \
    -H 'Accept: application/json' \
    -H 'Content-Type: application/json'

To confirm, we'll give the details of the check once again.

Snooze and unsnooze a check

You can temporarily snooze, or silence, a particular check. We will still perform the checks, but won't send out any notifications in the period that a check is snoozed. For more details on how this option works, have a look at our snooze documentation.

If you prefer to stop monitoring a check for a particular period, it's better to disable it and enable it again later on.

To snooze a check, you can call the /api/checks/{id}/snooze endpoint and tell it how long the check should be snoozed using the minutes payload, formatted in JSON.

$ OHDEAR_TOKEN="your API token"
$ curl -X POST https://ohdear.app/api/checks/1/snooze \
    -H "Authorization: Bearer $OHDEAR_TOKEN" \
    -H 'Accept: application/json' \
    -H 'Content-Type: application/json' \
    -d '{"minutes":"10"}'

If you receive an HTTP/1.1 200 OK response, the snooze was applied correctly.

To unsnooze, or remove the silencing of alerts, you can call the /api/checks/{id}/unsnooze endpoint.

$ curl -X POST https://ohdear.app/api/checks/1/unsnooze \
    -H "Authorization: Bearer $OHDEAR_TOKEN" \
    -H 'Accept: application/json' \
    -H 'Content-Type: application/json'

If you once again received an HTTP/1.1 200 OK response, the snooze was correctly removed.

Return properties

The response gives you some basic details of a check.

  • id: an internal identifier to Oh Dear
  • type: what type of check this is. Possible values are: uptime, performance, broken_links, certificate_health, mixed_content, cron, dns, application_health, and certificate_transparency.
  • label: a human readable label of the check
  • enabled: a boolean value to indicate if this check is enabled or not. Possible values are: true or false.
  • latest_run_ended_at: a timestamp, in UTC, of the last time this check was run
  • latest_run_result: the status of the last run, can be pending, succeeded, warning or failed
  • summary: a human readable summary of the check result

More properties will be added over time.

Uptime

If a site has the uptime check enabled, you can query the uptime percentages via the /api/uptime endpoint. To use this endpoint you'll need to now the site id of your site. You can get all sites ids by calling the get all sites endpoint.

To retrieve you'll need to specify a period via the started_at and ended_at filters. The period may not be longer than 2 years. The split value determines how fine grained the answer periods should be. Valid values are hour, day and month.

In this example we are going to get the uptime for site id 1.

$ OHDEAR_TOKEN="your API token"
$ curl "https://ohdear.app/api/sites/1/uptime?filter[started_at]=20180101000000&filter[ended_at]=20180101235959&split=day" \
    -H "Authorization: Bearer $OHDEAR_TOKEN" \
    -H 'Accept: application/json' \
    -H 'Content-Type: application/json'

Here's what the output could look like:

[
   {"datetime":"2018-01-01 00:00:00","uptime_percentage":100},
   {"datetime":"2018-01-01 01:00:00","uptime_percentage":99.76},
   {"datetime":"2018-01-01 02:00:00","uptime_percentage":100},
   {"datetime":"2018-01-01 03:00:00","uptime_percentage":98.34},
   ...
   {"datetime":"2018-01-01 23:00:00","uptime_percentage":100}
]

Downtime

You can query the downtime via the /api/sites/{siteId}/downtime endpoint. To use this endpoint you'll need to now the site id of your site. You can get all sites ids by calling the get all sites endpoint.

To retrieve you'll need to specify a period via the started_at and ended_at filters.

In this example we are going to get the downtime periods for site number 1.

$ OHDEAR_TOKEN="your API token"
$ curl "https://ohdear.app/api/sites/1/downtime?filter[started_at]=20180101150000&filter[ended_at]=20180101160000" \
    -H "Authorization: Bearer $OHDEAR_TOKEN" \
    -H 'Accept: application/json' \
    -H 'Content-Type: application/json'

Here's what the output could look like:

{
    "data": [
        {
            "id": 1,
            "started_at": "2018-01-01 15:00:00",
            "ended_at": "2018-01-01 15:07:00",
            "notes_html": "We contacted our provider and they fixed the issue.",
            "notes_markdown": "We contacted our provider and they fixed the issue."
        }
    ]
}

Deleting a downtime period

You can delete a downtime period by calling the /api/downtime/{downtimeId} endpoint. Make sure to use the DELETE http verb. To use this endpoint you'll need to now the downtime id, which you can get to by calling the get downtime endpoint.

Performance records

Retrieving performance records

You can retrieve all performance records by calling the /performance-records endpoint. This can be done per website in your Oh Dear account, so you'll need to know your site's ID first.

A filter is necessary: you decide from when to when the data should be returned.

In this example we'll get a list of all sites and use the site ID to retrieve the performance data.

$ OHDEAR_TOKEN="your API token"
$ curl https://ohdear.app/api/sites \
    -H "Authorization: Bearer $OHDEAR_TOKEN" \
    -H 'Accept: application/json' \
    -H 'Content-Type: application/json'

{
  "data": [
    {
      "id": 1,
      "url": "https://www.yoursite.tld",
      "...",
    }
  ]
}

Here, we'll query the performance data between yesterday and today, on the 1m timeframe. That's our most granular & most detailed timeframe available.

$ curl https://ohdear.app/api/sites/1/performance-records?filter[start]=php echo date("YmdHis", strtotime("-1 day")) ?>&filter[end]=php echo date("YmdHis") ?>&filter[group_by]=minute \
    -H "Authorization: Bearer $OHDEAR_TOKEN" \
    -H 'Accept: application/json' \
    -H 'Content-Type: application/json'

{
  "data": [
    {
      "dns_time_in_seconds": 0.001399,
      "tcp_time_in_seconds": 0.01651,
      "ssl_handshake_time_in_seconds": 0.053852,
      "remote_server_processing_time_in_seconds": 0.021595,
      "download_time_in_seconds": 0.000535,
      "total_time_in_seconds": 0.09389099999999999,
      "curl": {
        "namelookup_time": 0.001399,
        "connect_time": 0.017909,
        "appconnect_time": 0.071761,
        "starttransfer_time": 0.093356,
        "pretransfer_time": 0.071864,
        "redirect_time": 0,
        "total_time": 0.093891,
        "header_size": 1261,
        "size_download": 12814,
        "speed_download": 137784
      },
      "created_at": "2021-08-10 18:57:00"
    {
      ...
    }
  ],
}

If there are no performance records in the requested period, you'll receive an empty data array.

{
    "data": []
}

Selecting the granularity for data

In the example above, we grouped the performance records per minute. These records are stored for roughly 14 days. We also stored performance records per hour (which are kept for a couple of weeks) and per day (which are kept eternally).

You can request the hourly and daily records by passing hour or day to group_by.

Sorting the results

By default, the records will be sorted by newest records first. In other words, the most recent performance data will always be on top.

You can change the sorting by adding an explicit sort=created_at query parameter to the API call. You can negate the sort (ie: reverse it) by making it sort=-created_at.

$ curl https://ohdear.app/api/sites/1/performance-records?filter[start]=php echo date("YmdHis", strtotime("-1 day")) ?>&filter[end]=php echo date("YmdHis") ?>&filter[group_by]=minute&sort=created_at \
    -H "Authorization: Bearer $OHDEAR_TOKEN" \
    -H 'Accept: application/json' \
    -H 'Content-Type: application/json'

The only field you can use to sort data is the created_at column.

Performance record data explained

The API returns the detailed performance metrics for each datapoint we have.

{
    "dns_time_in_seconds": 0.001399,
    "tcp_time_in_seconds": 0.01651,
    "ssl_handshake_time_in_seconds": 0.053852,
    "remote_server_processing_time_in_seconds": 0.021595,
    "download_time_in_seconds": 0.000535,
    "total_time_in_seconds": 0.09389099999999999,
    "curl": {
        "namelookup_time": 0.001399,
        "connect_time": 0.017909,
        "appconnect_time": 0.071761,
        "starttransfer_time": 0.093356,
        "pretransfer_time": 0.071864,
        "redirect_time": 0,
        "total_time": 0.093891,
        "header_size": 1261,
        "size_download": 12814,
        "speed_download": 137784
    },
    "created_at": "2021-08-10 18:57:00"
},

In the curl key, you find the raw performance values that curl produces when we called your site. In most cases, it will be expressed in milliseconds, not seconds. So 0.0429 can be read as 42.9ms. By multiplying each value by 1,000, you get the value in milliseconds.

The data represents the following part of the request:

  • time_namelookup: The time it takes to resolve the domain name to an IP address via DNS.
  • time_connect: The time it takes to connect to the remote host (TCP three-way handshake).
  • time_appconnect: The total time it took for the TLS handshake to complete (cipher negotiation & encryption).
  • time_remoteserver: The time it took the server to process the request and start sending the first byte of the page.
  • time_download: The time, in seconds, it took for the page to be downloaded.
  • time_total: The total time it took from start to finish of this request.

If a site has the broken links check enabled, you can get all detected broken links via the /api/broken-links endpoint. To use this endpoint you'll need to now the site id of your site. You can get all sites ids by calling the get all sites endpoint.

In this example we are going to get the broken-links for site number 1.

$ OHDEAR_TOKEN="your API token"
$ curl https://ohdear.app/api/broken-links/1 \
    -H "Authorization: Bearer $OHDEAR_TOKEN" \
    -H 'Accept: application/json' \
    -H 'Content-Type: application/json'

Here's what the output could look like:

{
    "data": [
        {
            "crawled_url": "https://example.com/broken",
            "relative_crawled_url": "/broken",
            "status_code": 404,
            "found_on_url": "https://example.com",
            "relative_found_on_url": "https://example.com",
            "internal": true
        }
    ]
}

Mixed content

Retrieving mixed content

If a site has the mixed content check enabled, you can get all detected mixed content via the /api/mixed-content endpoint. To use this endpoint you'll need to now the site id of your site. You can get all sites ids by calling the get all sites endpoint.

In this example we are going to get the broken-links for site number 1.

$ OHDEAR_TOKEN="your API token"
$ curl https://ohdear.app/api/mixed-content/1 \
    -H "Authorization: Bearer $OHDEAR_TOKEN" \
    -H 'Accept: application/json' \
    -H 'Content-Type: application/json'

Here's what the output could look like:

{
    "data": [
        {
            "element_name": "img",
            "mixed_content_url": "http://example.com/image.jpg",
            "found_on_url": "https://example.com"
        }
    ]
}

Certificate Health

Retrieving info on the certificate health

If a site has the certificate health check enabled, you can get feedback on the result via the /api/certificate-health endpoint. To use this endpoint you'll need to now the site id of your site. You can get all sites ids by calling the get all sites endpoint.

Here's an example where we get the certificate health of the site with ID 1.

$ OHDEAR_TOKEN="your API token"
$ curl https://ohdear.app/api/certificate-health/1 \
    -H "Authorization: Bearer $OHDEAR_TOKEN" \
    -H 'Accept: application/json' \
    -H 'Content-Type: application/json'

The output will be an object with these 3 keys:

  • certificate_details: an array with some details on the detected certificate
  • certificate_checks: an array with info on the checks we performed on the certificate
  • certificate_chain_issuers: an array containing the names of all the issuers in the complete certificate chain

Here's what it looks like.

{
    "certificate_details": {
        "issuer": "Let's Encrypt Authority X3",
        "valid_from": "2019-09-10 15:16:01",
        "valid_until": "2019-12-09 15:16:01"
    },
    "certificate_checks": [
        {
            "type": "notFound",
            "label": "Certificate present",
            "passed": true
        },
        {
            "type": "expiresSoon",
            "label": "Will not expire in the next 14 days",
            "passed": true
        },
        {
            "type": "coversWrongDomain",
            "label": "Covers the right domain",
            "passed": true
        },
        {
            "type": "doesNotConnectWithRootCertificate",
            "label": "Connects with a root certificate",
            "passed": true
        },
        {
            "type": "notYetActive",
            "label": "Is currently active",
            "passed": true
        },
        {
            "type": "isSelfSigned",
            "label": "Is not self signed",
            "passed": true
        },
        {
            "type": "usesInvalidHash",
            "label": "Uses valid hash",
            "passed": true
        },
        {
            "type": "hasExpired",
            "label": "Has not expired",
            "passed": true
        },
        {
            "type": "hasChanged",
            "label": "Unchanged since last checked",
            "passed": true
        }
    ],
    "certificate_chain_issuers": [
        "US, Let's Encrypt, Let's Encrypt Authority X3",
        "Digital Signature Trust Co., DST Root CA X3"
    ]
}

To determine the overal health of the certificate, you can look at all the checks in the certificate_checks result.

Those with a value of "passed": false have a failed check.

User Info

Retrieve your team & user info

Make a GET request to the /api/me endpoint.

$ OHDEAR_TOKEN="your API token"
$ curl https://ohdear.app/api/me \
    -H "Authorization: Bearer $OHDEAR_TOKEN" \
    -H 'Accept: application/json' \
    -H 'Content-Type: application/json'

If the API call succeeded, you'll be presented with your team & user info.

Return properties

Here's an example payload of the API call.

{
    "id": 1,
    "name": "Firstname Lastname",
    "email": "you@domain.tld",
    "photo_url": "https://www.gravatar.com/avatar/...jpg",
    "teams": [
        {
            "id": 1,
            "name": "Your Team Name"
        }
    ]
}

Let's look at all the properties that are returned.

  • id: the identifier of the user this API key belongs to.
  • name, email and photo_url: personal information about your account.
  • teams: an array of teams this user belongs to. A user can be a member of several teams.

The teams property has an id (team ID) and a human readable name. The team id will be used throughout all API calls to determine what team you want to add sites to.

Status Pages

You can make a GET HTTP call to the /api/status-pages endpoint to retrieve all your configured status pages.

$ OHDEAR_TOKEN="your API token"
$ curl https://ohdear.app/api/status-pages \
    -H "Authorization: Bearer $OHDEAR_TOKEN" \
    -H 'Accept: application/json' \
    -H 'Content-Type: application/json'

As a result, you'll get a list of all your status pages and their metadata.

{
  "data": [
    {
      "id": 1,
      "team": {
        "id": 1,
        "name": "Your Team Name"
      },
      "title": "Your Status Page Title",
      "domain": "status.your-domain.tld",
      "slug": "autem-quos-accusantium-esse-ex-numquam-odio",
      "full_url": "https://ohdear.app/status-page/autem-quos-accusantium-esse-ex-numquam-odio",
      "timezone": "Europe/Brussels",
      "summarized_status": "up",
      "sites": [
        {
          "id": 1,
          "url": "https://site1.tld",
          ...
        },
        {
          "id": 7,
          "url": "https://site2.tld",
          ...
        }
      ],
      "created_at": "2019-09-13 07:06:51",
      "updated_at": "2019-09-13 07:06:51"
    }
  ],
  "links": {
    "first": "https://ohdear.app/api/status-pages?page%5Bnumber%5D=1",
    "last": "https://ohdear.app/api/status-pages?page%5Bnumber%5D=1",
    "prev": null,
    "next": null
  },
  "meta": {
    "current_page": 1,
    "from": 1,
    "last_page": 1,
    "path": "https://ohdear.app/api/status-pages",
    "per_page": 200,
    "to": 2,
    "total": 2
  }
}

There's a lot of data in there, let's unpack it.

The following fields are available in the output:

  • data: this is an array that contains a list of all your status pages.
  • team: because you can belong to multiple teams, we'll clarify which team this status page belongs to.
  • summarized_status: this can either be up, down or unknown. It's down when at least one of the sites in the status page has an uptime check that reported it as down.
  • sites: this is an array with all sites that are added to this status page. It will also contain all checks from each website, so you have all information easily available to you.
  • the links and meta output are for pagination when you have many status pages.

Retrieve a single status page

You can also pass the ID of a status page to the /api/status-pages/{id} endpoint to get the details of a specific status page.

In this example, we'll retrieve the status page with ID 1.

$ OHDEAR_TOKEN="your API token"
$ curl https://ohdear.app/api/status-pages/1 \
    -H "Authorization: Bearer $OHDEAR_TOKEN" \
    -H 'Accept: application/json' \
    -H 'Content-Type: application/json'

The resulting output will contain the details of that specific status page. Note that it does not have the data container that is used when retrieving all sites through the API.

{
  "id": 1,
  "team": {
    "id": 1,
    "name": "Your Team Name"
  },
  "title": "Your Status Page Title",
  ...
  "updates": [
    {
      "id": 65,
      "title": "Your status page update title",
      ...
    },
    ...
  ],
  "sites": [
    {
      "id": 1,
      "url": "https://site1.tld",
    },
    ...
  ]
}

In addition to the similar output of the /api/status-pages endpoint described above, when you get the data from a single status page we'll also include its updates.

This will contain an array of all status page updates & messages that have been posted to your status page.

For more details, have a look at our status page updates API documentation.

The rest of the data is similar to the output described above.

Delete a status page

If you make a DELETE HTTP call to the /api/status-pages/ID, you can delete a status page through the API.

In this example we are going to delete the status page with ID 99.

$ OHDEAR_TOKEN="your API token"
$ curl -i -X DELETE https://ohdear.app/api/status-pages/99 \
    -H "Authorization: Bearer $OHDEAR_TOKEN" \
    -H 'Accept: application/json' \
    -H 'Content-Type: application/json'

If you get an HTTP/1.1 204 No Content response, the status page was successfully deleted. Anything else will indicate an error.

HTTP/1.1 204 No Content
X-RateLimit-Limit: 180
X-RateLimit-Remaining: 176
...

Each status page can contain updates or messages. These are used to communicate to your customers or clients in times of downtime or maintenance.

You can post these messages from your dashboard or with our API.

To list the updates or messages from a single status page, you'll need to know its ID. You can retrieve that using the /api/status-pages API call explained in the status pages API documentation.

Once you have your ID, you can get the details as follows:

$ OHDEAR_TOKEN="your API token"
$ curl https://ohdear.app/api/status-pages/1/updates \
    -H "Authorization: Bearer $OHDEAR_TOKEN" \
    -H 'Accept: application/json' \
    -H 'Content-Type: application/json'

The resulting output will contain an array of all the updates to that specific status page.

If there are no status messages, the array will be empty.

{
    "data": []
}

If there are messages, we'll return those in the data field.

{
    "data": [
        {
            "id": 65,
            "title": "3rd party API issue resolved",
            "text": "We have contacted our API provider and they have resolved the situation, everything is back to normal. We apologize for the inconvenience!",
            "pinned": false,
            "severity": "resolved",
            "time": "2019-09-16 08:24:00",
            "status_page_url": "https://ohdear.app/status-page/your-slug"
        },
        {
            "id": 64,
            "title": "We are experiencing an outage on our service",
            "text": "Due to errors in our 3rd party API provider, we are experiencing an outage of our website. Our team is working on getting it resolved ASAP.",
            "pinned": false,
            "severity": "high",
            "time": "2019-09-16 08:11:00",
            "status_page_url": "https://ohdear.app/status-page/your-slug"
        }
    ]
}

These are sorted by newest message to oldest. The output contains the following fields:

  • id: the ID of that particular update
  • title and text: these are shown on your status page
  • pinned: when set to true, this update will be posted at the very top of your status page. There can only be 1 pinned message.
  • severity: these can be info, warning, high, resolved or scheduled. You are free to use these any way you like. The resolved updates will be posted in green on your status page to inform the user the problem has been resolved.
  • time: the date in UTC at which this status page was posted. This will get translated to your configured timezone.

Post a new update to your status page

To add a new update or message to your status page, you can make a POST call to the /api/status-page-updates endpoint.

$ OHDEAR_TOKEN="your API token"
$ curl -X POST https://ohdear.app/api/status-page-updates \
    -H "Authorization: Bearer $OHDEAR_TOKEN" \
    -H 'Accept: application/json' \
    -H 'Content-Type: application/json' \
    -d '{"status_page_id":1, "title":"Our site is down", "text":"We are working on it!", "severity":"high", "time":"2019-09-16 10:24","pinned":true}'

As a confirmation, we'll return an HTTP/1.1 201 Created with the received data fields.

{
    "id": 66,
    "title": "Our site is down",
    "text": "We are working on it!",
    "pinned": true,
    "severity": "high",
    "time": "2019-09-16 08:24:00",
    "status_page_url": "https://ohdear.app/status-page/your-slug"
}

The POST API call should contain a valid json body with the following fields.

  • status_page_id: the ID of the status page where you want to add this update.
  • title: the titel of your status update
  • text: a longer text describing what is happening or how you're resolving the problem
  • severity are: info, warning, high, resolved or scheduled.
  • time: a date field that acts as a timestamp for this update, should be in UTC in the Y-m-d H:i format.
  • pinned: whether this status page message should be pinned to the very top of the page. There can only be 1 pinned message, when set to true it will remove the pinned attribute from any other message.
  • status_page_url: the public URL of your status page. If you have configured a custom domain, this will point to your custom domain - otherwise it'll be the URL with your status page slug on the ohdear.app domain.

Delete an update on your status page

Let's use the API to delete the status message we just posted above, the one with ID 66.

$ OHDEAR_TOKEN="your API token"
$ curl -X DELETE https://ohdear.app/api/status-page-updates/66 \
    -H "Authorization: Bearer $OHDEAR_TOKEN" \
    -H 'Accept: application/json' \
    -H 'Content-Type: application/json'

If the response code is HTTP/1.1 204 No Content, the deletion of the status update was successful.

Maintenance windows

Retrieving maintenance periods

You can list all maintenance windows by calling the /maintenance-periods endpoint. This can be done per website in your Oh Dear account, so you'll need to know your site's ID first.

In this example we'll get a list of all sites and use the site ID to retrieve the maintenance periods.

$ OHDEAR_TOKEN="your API token"
$ curl https://ohdear.app/api/sites \
    -H "Authorization: Bearer $OHDEAR_TOKEN" \
    -H 'Accept: application/json' \
    -H 'Content-Type: application/json'

{
  "data": [
    {
      "id": 1,
      "url": "https://www.yoursite.tld",
      "...",
    }
  ]
}


$ curl https://ohdear.app/api/sites/1/maintenance-periods \
    -H "Authorization: Bearer $OHDEAR_TOKEN" \
    -H 'Accept: application/json' \
    -H 'Content-Type: application/json'

{
  "data": [
    {
      "id": 101,
      "site_id": 1,
      "starts_at": "2020-01-09 10:37:24",
      "ends_at": "2020-01-09 10:42:24"
    },
    {
      "id": 102,
      "site_id": 1,
      "starts_at": "2020-01-09 10:37:32",
      "ends_at": "2020-01-09 10:42:32"
    },
}

If there are no maintenance periods, you'll receive an empty data array.

{
    "data": []
}

If there are maintenance windows, we'll show the time of each start end end period.

{
    "data": [
        {
            "starts_at": "2020-01-09 14:00:00",
            "ends_at": "2020-01-10 14:00:00"
        }
    ]
}

These dates are all shown in the timezone of your team. If your timezone is configured as America/Vancouver, you'll see the dates & times shown in your own local timezone.

Creating a new maintenance period on-demand

This method applies on a per-site basis. If you want to put the site with ID 1 in maintenance right now, you can call this API method.

$ OHDEAR_TOKEN="your API token"
$ curl -X POST https://ohdear.app/api/sites/1/start-maintenance \
    -H "Authorization: Bearer $OHDEAR_TOKEN" \
    -H 'Accept: application/json' \
    -H 'Content-Type: application/json'

{
  "id": 101,
  "site_id": 1,
  "starts_at": "2020-01-09 10:28:54",
  "ends_at": "2020-01-09 11:28:54"
}

This will start a maintenance period that, by default, will last for 60 minutes. In the response, you'll find the confirmation of the start- and end-date.

To stop the maintenance period, call the /stop-maintenance endpoint.

$ OHDEAR_TOKEN="your API token"
$ curl -X POST https://ohdear.app/api/sites/1/stop-maintenance \
    -H "Authorization: Bearer $OHDEAR_TOKEN" \
    -H 'Accept: application/json' \
    -H 'Content-Type: application/json'

This will change the end-date of the currently active maintenance period to the time you've called the API.

This way, you still have a list of maintenance periods to look back on (as an audit list).

On-demand maintenance window with limited duration

If you prefer, you can also pass along the amount of seconds a maintenance period needs to be active in the /start-maintenance API call. This can be lowered or increased depending on your needs and provides a safe fallback in case your scripts execute the start-maintenance API call, but never get to the stop-maintenance call.

To do so, add a stop_maintenance_after_seconds POST value in JSON, as shown here.

$ OHDEAR_TOKEN="your API token"
$ curl -X POST https://ohdear.app/api/sites/1/start-maintenance \
    -H "Authorization: Bearer $OHDEAR_TOKEN" \
    -H 'Accept: application/json' \
    -H 'Content-Type: application/json' \
    -d '{"stop_maintenance_after_seconds":"300"}'

{
  "id": 101,
  "site_id": 1,
  "starts_at": "2020-01-09 10:37:32",
  "ends_at": "2020-01-09 10:42:32"
}

This will create a maintenance period for 300 seconds, or 5 minutes, as confirmed by the JSON output.

Creating a maintenance period with custom start and end times

If you don't use the on-demand maintenance windows as shown above, you can create maintenance windows with a custom start- and end-date. This allows you to schedule maintenance ahead of times.

Since maintenance windows are applicable per website, you need the site ID of the website you want to put in maintenance.

$ OHDEAR_TOKEN="your API token"
$ curl -X POST https://ohdear.app/api/maintenance-periods \
    -H "Authorization: Bearer $OHDEAR_TOKEN" \
    -H 'Accept: application/json' \
    -H 'Content-Type: application/json' \
    -d '{"site_id":"1", "starts_at":"2020-02-01 14:00","ends_at":"2020-02-01 18:00"}'

{
  "id": 101,
  "site_id": "1",
  "starts_at": "2020-02-01 14:00:00",
  "ends_at": "2020-02-01 18:00:00"
}

The API expects the dates to be formatted as Y:m:d H:i (no seconds) and the ends_at needs to be further in the future than the starts_at.

All dates should be in your local timezone, as configured in your team settings. (You don't need to convert anything to UTC, write the dates as they feel natural to you.)

Deleting a maintenance period

To delete a maintenance period, you need its ID. That can be retrieved with the /maintenance-periods API call, as shown above.

$ OHDEAR_TOKEN="your API token"
$ curl -X DELETE https://ohdear.app/api/maintenance-periods/101 \
    -H "Authorization: Bearer $OHDEAR_TOKEN" \
    -H 'Accept: application/json' \
    -H 'Content-Type: application/json'

The example above deletes the maintenance period with ID 101.

Cron Job Monitoring

Get all cron jobs for a website

Cron job monitors are attached to a website in Oh Dear. To retrieve a list of monitored cron jobs, you'll the website ID first.

The /api/sites/{$siteId}/cron-checks endpoint lists all your cron job monitors for that particular site.

$ OHDEAR_TOKEN="your API token"
$ curl https://ohdear.app/api/sites/1/cron-checks \
    -H "Authorization: Bearer $OHDEAR_TOKEN" \
    -H 'Accept: application/json' \
    -H 'Content-Type: application/json'

As a result, you get the details for every cron job monitor attached to this site, together with its latest status:

{
    "data": [
        {
            "id": 1,
            "uuid": "0d210b09",
            "name": "cronjob number one",
            "type": "simple",
            "description": "a description goes here",
            "frequency_in_minutes": 15,
            "grace_time_in_minutes": 5,
            "cron_expression": null,
            "server_timezone": "Europe/Brussels",
            "ping_url": "https://ping.ohdear.app/0d210b09",
            "created_at": "2020-07-28 13:27:02",
            "latest_result": "pingFinished",
            "latest_ping_at": "2020-11-16 09:19:40",
            "human_readable_latest_ping_at": "5 minutes ago"
        },
        {
            "id": 2,
            "uuid": "8eb64808",
            "name": "cronjob number two",
            "type": "simple",
            "description": "a description goes here",
            "frequency_in_minutes": 60,
            "grace_time_in_minutes": 10,
            "cron_expression": null,
            "server_timezone": "Europe/Brussels",
            "ping_url": "https://ping.ohdear.app/8eb64808",
            "created_at": "2020-07-28 13:27:02",
            "latest_result": "pingFinished",
            "latest_ping_at": "2020-11-16 09:19:40",
            "human_readable_latest_ping_at": "5 minutes ago"
        }
    ]
}

The response is a JSON encoded array with all the details of the cron jobs you defined to be monitored.

Result types

The latest_result response in the API can be one of the following values.

These are values actively submitted by your application to your cron monitoring URL endpoint:

  • pingStarting: we have received the "started" pingback from your application
  • pingFinished: we have received the "finished" pingback from your application, indicating no errors occurred
  • pingFailed: we have received the "failed" pingback from your application, indicating errors have occured

These are values we may have detected ourselves, without active participation from your application:

  • checkRanTooLate: because we did not receive a new ping URL on time, we have marked the cron task as failed because it ran too late
  • sentCronNotExutedOnTimeNotification: because the check didn't execute on time, we have sent the "did not run on time" notification
  • sentPingFailedNotification: your application reported us that the last ping contained a failure, we have now sent a notification that the ping failed

The success states of a cronjob are determined only by the pingFinished result. All other types indicate that we are either waiting on a ping, have received a failed ping, or have received no ping at all.

Create a simple cron job monitor

You can create a new cron job monitor using our API. You'll need the site ID where you want to attach the new monitor to.

$ OHDEAR_TOKEN="your API token"
$ curl -X POST https://ohdear.app/api/sites/1/cron-checks \
    -H "Authorization: Bearer $OHDEAR_TOKEN" \
    -H 'Accept: application/json' \
    -H 'Content-Type: application/json' \
    -d '{
      "name": "your cron job name",
      "type": "simple",
      "frequency_in_minutes": 10,
      "grace_time_in_minutes": 15,
      "description": "a description goes here"
    }'

The example above will create a new cron job monitor by providing both the frequency and the gracetime. Note how the type is set to simple.

The response will include the Ping URL you can point your cron jobs to:

{
    "id": 12,
    "uuid": "ba4322cf",
    "name": "your cron job name",
    "type": "simple",
    "description": "a description goes here",
    "frequency_in_minutes": 10,
    "grace_time_in_minutes": 15,
    "cron_expression": "",
    "server_timezone": null,
    "ping_url": "https://ping.ohdear.app/ba4322cf",
    "created_at": "2020-08-03 12:18:33"
}

The ping_url should be used in your scripts to report back the status of your cron jobs to us.

Create a new cron job monitor via crontab expression

Alternatively, you can create a new cron job monitor using the crontab expression as well.

Note how in this example the type is set to cron instead of simple.

$ OHDEAR_TOKEN="your API token"
$ curl -X POST https://ohdear.app/api/sites/1/cron-checks \
    -H "Authorization: Bearer $OHDEAR_TOKEN" \
    -H 'Accept: application/json' \
    -H 'Content-Type: application/json' \
    -d '{
      "name": "your cron job name",
      "type": "cron",
      "cron_expression":"* * * * *",
      "grace_time_in_minutes": 10,
      "description": "a description goes here",
      "server_timezone": "UTC"
    }'

The example above will create a new cron job monitor using the crontab expression * * * * * to indicate it should run every minute.

The response will include the Ping URL you can point your cron jobs to:

{
    "id": 10,
    "uuid": "19eea41a",
    "name": "your cron job name",
    "type": "cron",
    "description": "a description goes here",
    "frequency_in_minutes": 0,
    "grace_time_in_minutes": 10,
    "cron_expression": "* * * * *",
    "server_timezone": "UTC",
    "ping_url": "https://ping.ohdear.app/19eea41a",
    "created_at": "2020-08-03 12:13:53"
}

The ping_url should be used in your scripts to report back the status of your cron jobs to us.

Bulk cron job synchronization

For our PHP-SDK, we've created a mass-update endpoint you can use to update all cron jobs for a single site. This will remove any cron job not explicitly in this sync API call, so it is a destructive action.

$ OHDEAR_TOKEN="your API token"
$ curl -X POST https://ohdear.app/api/sites/1/cron-checks/sync \
    -H "Authorization: Bearer $OHDEAR_TOKEN" \
    -H 'Accept: application/json' \
    -H 'Content-Type: application/json' \
    -d '{
        "cron_checks": [
          {
            "name": "cron job #1",
            "type": "cron",
            "cron_expression":"* * * * *",
            "grace_time_in_minutes": 10,
            "description": "description for cron #1",
            "server_timezone": "UTC"
          },
          {
            "name": "cron job #2",
            "type": "cron",
            "cron_expression":"* * * * *",
            "grace_time_in_minutes": 10,
            "description": "description for cron #2",
            "server_timezone": "UTC"
          }
        ]
    }'

The return data, if the API call was successful, is a confirmation of each cron job definition together with all its metadata.

[
    {
        "id": 9,
        "uuid": "c1803dce",
        "name": "cron job #1",
        "type": "cron",
        "description": "description for cron #1",
        "frequency_in_minutes": null,
        "grace_time_in_minutes": 10,
        "cron_expression": "* * * * *",
        "server_timezone": "UTC",
        "ping_url": "https://ping.ohdear.app/c1803dce",
        "created_at": "2020-09-03 19:20:25",
        "latest_result": "pingFinished",
        "latest_ping_at": "2020-11-16 09:19:40"
    },
    {
        "id": 10,
        "uuid": "40e8e39e",
        "name": "cron job #2",
        "type": "cron",
        "description": "description for cron #2",
        "frequency_in_minutes": null,
        "grace_time_in_minutes": 10,
        "cron_expression": "* * * * *",
        "server_timezone": "UTC",
        "ping_url": "https://ping.ohdear.app/40e8e39e",
        "created_at": "2020-09-03 19:20:25",
        "latest_result": "pingFinished",
        "latest_ping_at": "2020-11-16 09:19:40"
    }
]

Error handling

If an error occured, you'll be given a non-HTTP/200 response code. The resulting payload might look like this.

{
    "message": "The given data was invalid.",
    "errors": {
        "name": ["There already exist a cron check with this name for this site."]
    }
}

DNS Records

Retrieving DNS history for a site

To retrieve a list of your entire Dns history and issues, you'll the website ID first.

The /api/sites/{$siteId}/dns-history-items endpoint lists all DNS related information we retrieved for your domain.

$ OHDEAR_TOKEN="your API token"
$ curl https://ohdear.app/api/sites/1/dns-history-items \
    -H "Authorization: Bearer $OHDEAR_TOKEN" \
    -H 'Accept: application/json' \
    -H 'Content-Type: application/json'

As a result, you get the history of the DNS records for your domain, together with all issues we found. Here's an example result for records retrieved for a https://freek.dev.

The results are sorted in reverse chronological order: the topmost item will contain your current DNS records.

{
  "data": [
    {
      "id": 2,
      "authoritative_nameservers": [
        "ns1.openprovider.nl",
        "ns2.openprovider.be",
        "ns3.openprovider.eu"
      ],
      "dns_records": [
        {
          "host": "freek.dev",
          "ttl": 1017,
          "class": "IN",
          "type": "A",
          "ip": "138.197.187.74"
        },
        {
          "host": "freek.dev",
          "ttl": 4435,
          "class": "IN",
          "type": "MX",
          "pri": 10,
          "target": "aspmx.l.google.com"
        },
        {
          "host": "freek.dev",
          "ttl": 4435,
          "class": "IN",
          "type": "MX",
          "pri": 20,
          "target": "alt1.aspmx.l.google.com"
        },
        {
          "host": "freek.dev",
          "ttl": 4435,
          "class": "IN",
          "type": "MX",
          "pri": 20,
          "target": "alt2.aspmx.l.google.com"
        },
        {
          "host": "freek.dev",
          "ttl": 4435,
          "class": "IN",
          "type": "MX",
          "pri": 30,
          "target": "aspmx2.googlemail.com"
        },
        {
          "host": "freek.dev",
          "ttl": 4435,
          "class": "IN",
          "type": "MX",
          "pri": 30,
          "target": "aspmx3.googlemail.com"
        },
        {
          "host": "freek.dev",
          "ttl": 4435,
          "class": "IN",
          "type": "NS",
          "target": "ns1.openprovider.nl"
        },
        {
          "host": "freek.dev",
          "ttl": 4435,
          "class": "IN",
          "type": "NS",
          "target": "ns2.openprovider.be"
        },
        {
          "host": "freek.dev",
          "ttl": 4435,
          "class": "IN",
          "type": "NS",
          "target": "ns3.openprovider.eu"
        },
        {
          "host": "freek.dev",
          "ttl": 4435,
          "class": "IN",
          "type": "SOA",
          "mname": "ns1.openprovider.nl",
          "rname": "dns.openprovider.eu",
          "serial": 2021080201,
          "refresh": 10800,
          "retry": 3600,
          "expire": 604800,
          "minimum_ttl": 3600
        },
        {
          "host": "freek.dev",
          "ttl": 1060,
          "class": "IN",
          "type": "TXT",
          "txt": "v=spf1 include:amazonses.com include:eu.mailgun.org include:spf.factuursturen.be include:sendgrid.net include:_spf.google.com a mx ~all"
        }
      ],
      "raw_dns_records": {
        "ns1.openprovider.nl": [
          "freek.dev.\t\t1017\tIN\tA\t138.197.187.74",
          "freek.dev.\t\t1060\tIN\tTXT\t\"v=spf1 include:amazonses.com include:eu.mailgun.org include:spf.factuursturen.be include:sendgrid.net include:_spf.google.com a mx ~all\"",
          "freek.dev.\t\t4435\tIN\tMX\t10\taspmx.l.google.com.",
          "freek.dev.\t\t4435\tIN\tMX\t20\talt1.aspmx.l.google.com.",
          "freek.dev.\t\t4435\tIN\tMX\t20\talt2.aspmx.l.google.com.",
          "freek.dev.\t\t4435\tIN\tMX\t30\taspmx2.googlemail.com.",
          "freek.dev.\t\t4435\tIN\tMX\t30\taspmx3.googlemail.com.",
          "freek.dev.\t\t4435\tIN\tNS\tns1.openprovider.nl.",
          "freek.dev.\t\t4435\tIN\tNS\tns2.openprovider.be.",
          "freek.dev.\t\t4435\tIN\tNS\tns3.openprovider.eu.",
          "freek.dev.\t\t4435\tIN\tSOA\tns1.openprovider.nl.\tdns.openprovider.eu.\t2021080201\t10800\t3600\t604800\t3600"
        ],
        "ns2.openprovider.be": [
          "freek.dev.\t\t1060\tIN\tTXT\t\"v=spf1 include:amazonses.com include:eu.mailgun.org include:spf.factuursturen.be include:sendgrid.net include:_spf.google.com a mx ~all\"",
          "freek.dev.\t\t4435\tIN\tMX\t10\taspmx.l.google.com.",
          "freek.dev.\t\t4435\tIN\tMX\t20\talt1.aspmx.l.google.com.",
          "freek.dev.\t\t4435\tIN\tMX\t20\talt2.aspmx.l.google.com.",
          "freek.dev.\t\t4435\tIN\tMX\t30\taspmx2.googlemail.com.",
          "freek.dev.\t\t4435\tIN\tMX\t30\taspmx3.googlemail.com.",
          "freek.dev.\t\t4435\tIN\tNS\tns1.openprovider.nl.",
          "freek.dev.\t\t4435\tIN\tNS\tns2.openprovider.be.",
          "freek.dev.\t\t4435\tIN\tNS\tns3.openprovider.eu.",
          "freek.dev.\t\t4435\tIN\tSOA\tns1.openprovider.nl.\tdns.openprovider.eu.\t2021080201\t10800\t3600\t604800\t3600"
        ],
        "ns3.openprovider.eu": [
          "freek.dev.\t\t1017\tIN\tA\t138.197.187.74",
          "freek.dev.\t\t1060\tIN\tTXT\t\"v=spf1 include:amazonses.com include:eu.mailgun.org include:spf.factuursturen.be include:sendgrid.net include:_spf.google.com a mx ~all\"",
          "freek.dev.\t\t4435\tIN\tMX\t10\taspmx.l.google.com.",
          "freek.dev.\t\t4435\tIN\tMX\t20\talt1.aspmx.l.google.com.",
          "freek.dev.\t\t4435\tIN\tMX\t20\talt2.aspmx.l.google.com.",
          "freek.dev.\t\t4435\tIN\tMX\t30\taspmx2.googlemail.com.",
          "freek.dev.\t\t4435\tIN\tMX\t30\taspmx3.googlemail.com.",
          "freek.dev.\t\t4435\tIN\tNS\tns1.openprovider.nl.",
          "freek.dev.\t\t4435\tIN\tNS\tns2.openprovider.be.",
          "freek.dev.\t\t4435\tIN\tNS\tns3.openprovider.eu.",
          "freek.dev.\t\t4435\tIN\tSOA\tns1.openprovider.nl.\tdns.openprovider.eu.\t2021080201\t10800\t3600\t604800\t3600"
        ]
      },
      "issues": [
        {
          "name": "NameserversAreNotInSync",
          "nameservers": [
            "ns2.openprovider.be"
          ]
        }
      ],
      "diff_summary": "No changes",
      "created_at": "2021-11-05 16:07:38"
    },
    {
      "id": 1,
      "authoritative_nameservers": [
        "ns1.openprovider.nl",
        "ns2.openprovider.be",
        "ns3.openprovider.eu"
      ],
      "dns_records": [
        {
          "host": "freek.dev",
          "ttl": 1017,
          "class": "IN",
          "type": "A",
          "ip": "138.197.187.74"
        },
        {
          "host": "freek.dev",
          "ttl": 4435,
          "class": "IN",
          "type": "MX",
          "pri": 10,
          "target": "aspmx.l.google.com"
        },
        {
          "host": "freek.dev",
          "ttl": 4435,
          "class": "IN",
          "type": "MX",
          "pri": 20,
          "target": "alt1.aspmx.l.google.com"
        },
        {
          "host": "freek.dev",
          "ttl": 4435,
          "class": "IN",
          "type": "MX",
          "pri": 20,
          "target": "alt2.aspmx.l.google.com"
        },
        {
          "host": "freek.dev",
          "ttl": 4435,
          "class": "IN",
          "type": "MX",
          "pri": 30,
          "target": "aspmx2.googlemail.com"
        },
        {
          "host": "freek.dev",
          "ttl": 4435,
          "class": "IN",
          "type": "MX",
          "pri": 30,
          "target": "aspmx3.googlemail.com"
        },
        {
          "host": "freek.dev",
          "ttl": 4435,
          "class": "IN",
          "type": "NS",
          "target": "ns1.openprovider.nl"
        },
        {
          "host": "freek.dev",
          "ttl": 4435,
          "class": "IN",
          "type": "NS",
          "target": "ns2.openprovider.be"
        },
        {
          "host": "freek.dev",
          "ttl": 4435,
          "class": "IN",
          "type": "NS",
          "target": "ns3.openprovider.eu"
        },
        {
          "host": "freek.dev",
          "ttl": 4435,
          "class": "IN",
          "type": "SOA",
          "mname": "ns1.openprovider.nl",
          "rname": "dns.openprovider.eu",
          "serial": 2021080201,
          "refresh": 10800,
          "retry": 3600,
          "expire": 604800,
          "minimum_ttl": 3600
        },
        {
          "host": "freek.dev",
          "ttl": 1060,
          "class": "IN",
          "type": "TXT",
          "txt": "v=spf1 include:amazonses.com include:eu.mailgun.org include:spf.factuursturen.be include:sendgrid.net include:_spf.google.com a mx ~all"
        }
      ],
      "raw_dns_records": {
        "ns1.openprovider.nl": [
          "freek.dev.\t\t1017\tIN\tA\t138.197.187.74",
          "freek.dev.\t\t1060\tIN\tTXT\t\"v=spf1 include:amazonses.com include:eu.mailgun.org include:spf.factuursturen.be include:sendgrid.net include:_spf.google.com a mx ~all\"",
          "freek.dev.\t\t4435\tIN\tMX\t10\taspmx.l.google.com.",
          "freek.dev.\t\t4435\tIN\tMX\t20\talt1.aspmx.l.google.com.",
          "freek.dev.\t\t4435\tIN\tMX\t20\talt2.aspmx.l.google.com.",
          "freek.dev.\t\t4435\tIN\tMX\t30\taspmx2.googlemail.com.",
          "freek.dev.\t\t4435\tIN\tMX\t30\taspmx3.googlemail.com.",
          "freek.dev.\t\t4435\tIN\tNS\tns1.openprovider.nl.",
          "freek.dev.\t\t4435\tIN\tNS\tns2.openprovider.be.",
          "freek.dev.\t\t4435\tIN\tNS\tns3.openprovider.eu.",
          "freek.dev.\t\t4435\tIN\tSOA\tns1.openprovider.nl.\tdns.openprovider.eu.\t2021080201\t10800\t3600\t604800\t3600"
        ],
        "ns2.openprovider.be": [
          "freek.dev.\t\t1017\tIN\tA\t138.197.187.74",
          "freek.dev.\t\t1060\tIN\tTXT\t\"v=spf1 include:amazonses.com include:eu.mailgun.org include:spf.factuursturen.be include:sendgrid.net include:_spf.google.com a mx ~all\"",
          "freek.dev.\t\t4435\tIN\tMX\t10\taspmx.l.google.com.",
          "freek.dev.\t\t4435\tIN\tMX\t20\talt1.aspmx.l.google.com.",
          "freek.dev.\t\t4435\tIN\tMX\t20\talt2.aspmx.l.google.com.",
          "freek.dev.\t\t4435\tIN\tMX\t30\taspmx2.googlemail.com.",
          "freek.dev.\t\t4435\tIN\tMX\t30\taspmx3.googlemail.com.",
          "freek.dev.\t\t4435\tIN\tNS\tns1.openprovider.nl.",
          "freek.dev.\t\t4435\tIN\tNS\tns2.openprovider.be.",
          "freek.dev.\t\t4435\tIN\tNS\tns3.openprovider.eu.",
          "freek.dev.\t\t4435\tIN\tSOA\tns1.openprovider.nl.\tdns.openprovider.eu.\t2021080201\t10800\t3600\t604800\t3600"
        ],
        "ns3.openprovider.eu": [
          "freek.dev.\t\t1017\tIN\tA\t138.197.187.74",
          "freek.dev.\t\t1060\tIN\tTXT\t\"v=spf1 include:amazonses.com include:eu.mailgun.org include:spf.factuursturen.be include:sendgrid.net include:_spf.google.com a mx ~all\"",
          "freek.dev.\t\t4435\tIN\tMX\t10\taspmx.l.google.com.",
          "freek.dev.\t\t4435\tIN\tMX\t20\talt1.aspmx.l.google.com.",
          "freek.dev.\t\t4435\tIN\tMX\t20\talt2.aspmx.l.google.com.",
          "freek.dev.\t\t4435\tIN\tMX\t30\taspmx2.googlemail.com.",
          "freek.dev.\t\t4435\tIN\tMX\t30\taspmx3.googlemail.com.",
          "freek.dev.\t\t4435\tIN\tNS\tns1.openprovider.nl.",
          "freek.dev.\t\t4435\tIN\tNS\tns2.openprovider.be.",
          "freek.dev.\t\t4435\tIN\tNS\tns3.openprovider.eu.",
          "freek.dev.\t\t4435\tIN\tSOA\tns1.openprovider.nl.\tdns.openprovider.eu.\t2021080201\t10800\t3600\t604800\t3600"
        ]
      },
      "issues": [],
      "diff_summary": "No changes",
      "created_at": "2021-11-05 16:02:38"
    }
}

Possible values of issues

The issues property will return an array with issues we detected. Each item in that array will have a property name that can contain on of the following values:

  • CouldNotDiscoverNameservers: we couldn't find the authoritative nameservers for your domain
  • CouldNotFindAnyDnsRecords: some nameservers of your domain did not return any records. These nameservers are listed in the nameservers property of this array
  • NameserversAreNotInSync: a nameserver of your domain returned different records than the other nameservers. The names of the nameservers that are not in sync are listed in the nameservers property of this array

Application Health Monitoring

Retrieving application health check for a site

To retrieve a list of application health checks, you'll need the website ID first.

The /api/sites/{$siteId}/application-health-checks endpoint lists all application health checks that are running for your site.

$ OHDEAR_TOKEN="your API token"
$ curl https://ohdear.app/api/sites/1/application-health-checks \
    -H "Authorization: Bearer $OHDEAR_TOKEN" \
    -H 'Accept: application/json' \
    -H 'Content-Type: application/json'

This is what could get as a result:

{
    "data": [
        {
            "id": 1,
            "name": "DiskUsage",
            "label": "Disk usage",
            "status": "failed",
            "message": "The disk is nearly full (91%)",
            "short_summary": "91%",
            "meta": {
                "usage": 91
            },
            "detected_at": "2021-01-01 00:00:00",
            "updated_at": "2021-01-01 00:00:00"
        }
    ]
}

Available fields

The message property will be filled when a check failed. It will contain the message that we also have sent via a notification.

The short_summary property contains a string that we'll also display on the application health check overview of your site.

The status property can contain one of the following values:

  • ok: the check was ok
  • warning: the check is closed to failing
  • failed: the check did fail
  • crashed: something went wrong running the check itself
  • skipped: the check wasn't performed in this run

The meta property contains an object that contain extra info that was sent along with the check result.

Retrieving the history of a health check

The /api/sites/{$siteId}/application-health-checks/{$applicationHealthCheckId} endpoint lists the history of results of an application health check.

$ OHDEAR_TOKEN="your API token"
$ curl https://ohdear.app/api/sites/1/application-health-checks/1 \
    -H "Authorization: Bearer $OHDEAR_TOKEN" \
    -H 'Accept: application/json' \
    -H 'Content-Type: application/json'

It will return the history of the check results. The newest items appear first in the list.

{
    "data": [
        {
            "id": 2,
            "status": "ok",
            "message": "",
            "short_summary": "60%",
            "meta": {
                "usage": 60
            },
            "detected_at": "2021-01-01 00:01:00",
            "updated_at": "2021-01-01 00:01:00"
        },
        {
            "id": 1,
            "status": "failed",
            "message": "The disk is nearly full (91%)",
            "short_summary": "91%",
            "meta": {
                "usage": 91
            },
            "detected_at": "2021-01-01 00:00:00",
            "updated_at": "2021-01-01 00:00:00"
        }
    ]
}

Domain monitoring

Retrieving domain information for a site

To retrieve domain information of a site, you'll need the website ID first.

The /api/sites/{$siteId}/domain endpoint displays domain related information we retrieved for your domain.

$ OHDEAR_TOKEN="your API token"
$ curl https://ohdear.app/api/sites/1/domain \
    -H "Authorization: Bearer $OHDEAR_TOKEN" \
    -H 'Accept: application/json' \
    -H 'Content-Type: application/json'

The response contains the most important dates of the domain, and the domain status. In the rdap_domain_response key, you'll find the raw response we got from RDAP about your domain. The created_at key contains the date on which we queried RDAP.

Here's example output when monitoring google.com:

{
    "expires_at": "2028-09-14 04:00:00",
    "registered_at": "1997-09-15 04:00:00",
    "last_changed_at": "2019-09-09 15:39:04",
    "last_updated_in_rdap_db_at": "2022-06-11 00:32:59",
    "domain_statuses": {
        "client delete prohibited": true,
        "client transfer prohibited": true,
        "client update prohibited": true,
        "server delete prohibited": true,
        "server transfer prohibited": true,
        "server update prohibited": true
    },
    "rdap_domain_response": {
        "links": [
            {
                "rel": "self",
                "href": "https://rdap.verisign.com/com/v1/domain/GOOGLE.COM",
                "type": "application/rdap+json",
                "value": "https://rdap.verisign.com/com/v1/domain/GOOGLE.COM"
            },
            {
                "rel": "related",
                "href": "https://rdap.markmonitor.com/rdap/domain/GOOGLE.COM",
                "type": "application/rdap+json",
                "value": "https://rdap.markmonitor.com/rdap/domain/GOOGLE.COM"
            }
        ],
        "events": [
            {
                "eventDate": "1997-09-15T04:00:00Z",
                "eventAction": "registration"
            },
            {
                "eventDate": "2028-09-14T04:00:00Z",
                "eventAction": "expiration"
            },
            {
                "eventDate": "2019-09-09T15:39:04Z",
                "eventAction": "last changed"
            },
            {
                "eventDate": "2022-06-11T00:32:59Z",
                "eventAction": "last update of RDAP database"
            }
        ],
        "handle": "2138514_DOMAIN_COM-VRSN",
        "status": [
            "client delete prohibited",
            "client transfer prohibited",
            "client update prohibited",
            "server delete prohibited",
            "server transfer prohibited",
            "server update prohibited"
        ],
        "ldhName": "GOOGLE.COM",
        "notices": [
            {
                "links": [
                    {
                        "href": "https://www.verisign.com/domain-names/registration-data-access-protocol/terms-service/index.xhtml",
                        "type": "text/html"
                    }
                ],
                "title": "Terms of Use",
                "description": ["Service subject to Terms of Use."]
            },
            {
                "links": [
                    {
                        "href": "https://icann.org/epp",
                        "type": "text/html"
                    }
                ],
                "title": "Status Codes",
                "description": [
                    "For more information on domain status codes, please visit https://icann.org/epp"
                ]
            },
            {
                "links": [
                    {
                        "href": "https://icann.org/wicf",
                        "type": "text/html"
                    }
                ],
                "title": "RDDS Inaccuracy Complaint Form",
                "description": [
                    "URL of the ICANN RDDS Inaccuracy Complaint Form: https://icann.org/wicf"
                ]
            }
        ],
        "entities": [
            {
                "roles": ["registrar"],
                "handle": "292",
                "entities": [
                    {
                        "roles": ["abuse"],
                        "vcardArray": [
                            "vcard",
                            [
                                ["version", [], "text", "4.0"],
                                ["fn", [], "text", ""],
                                [
                                    "tel",
                                    {
                                        "type": "voice"
                                    },
                                    "uri",
                                    "tel:+1.2086851750"
                                ],
                                ["email", [], "text", "abusecomplaints@markmonitor.com"]
                            ]
                        ],
                        "objectClassName": "entity"
                    }
                ],
                "publicIds": [
                    {
                        "type": "IANA Registrar ID",
                        "identifier": "292"
                    }
                ],
                "vcardArray": [
                    "vcard",
                    [
                        ["version", [], "text", "4.0"],
                        ["fn", [], "text", "MarkMonitor Inc."]
                    ]
                ],
                "objectClassName": "entity"
            }
        ],
        "secureDNS": {
            "delegationSigned": false
        },
        "nameservers": [
            {
                "ldhName": "NS1.GOOGLE.COM",
                "objectClassName": "nameserver"
            },
            {
                "ldhName": "NS2.GOOGLE.COM",
                "objectClassName": "nameserver"
            },
            {
                "ldhName": "NS3.GOOGLE.COM",
                "objectClassName": "nameserver"
            },
            {
                "ldhName": "NS4.GOOGLE.COM",
                "objectClassName": "nameserver"
            }
        ],
        "objectClassName": "domain",
        "rdapConformance": [
            "rdap_level_0",
            "icann_rdap_technical_implementation_guide_0",
            "icann_rdap_response_profile_0"
        ]
    },
    "created_at": "2022-06-10 20:33:06"
}

Lighthouse SEO monitoring

To retrieve Lighthouse SEO reports of a site, you'll need the website ID first.

Getting the latest report

The /api/sites/{$siteId}/lighthouse-reports/latest endpoint displays that latest Lighthouse report we generated for your site.

$ OHDEAR_TOKEN="your API token"
$ curl https://ohdear.app/api/sites/1/lighthouse-reports/latest \
    -H "Authorization: Bearer $OHDEAR_TOKEN" \
    -H 'Accept: application/json' \
    -H 'Content-Type: application/json'

This will return a result like

{
    "id": 1,
    "performance_score": 50,
    "accessibility_score": 98,
    "best_practices_score": 92,
    "seo_score": 92,
    "progressive_web_app_score": 30,
    "first_contentful_paint_in_ms": 1851.45,
    "speed_index_in_ms": 1866,
    "largest_contentful_paint_in_ms": 1851.45,
    "time_to_interactive_in_ms": 2473.87,
    "total_blocking_time_in_ms": 123.77,
    "cumulative_layout_shift": 0.01,
    "performed_on_checker_server": "lighthouse-checker-frankfurt-1",
    "json_report": {
        /*
      Omitted for brevity, will contain the full JSON report generated by the lighthouse tool
      */
    },
    "issues": [
        {
            "category": "performance",
            "actualScore": 50,
            "notificationThreshold": 70
        }
    ],
    "created_at": "2023-01-14 00:00:55"
}

Getting a list of all reports

The /api/sites/{$siteId}/lighthouse-reports endpoint returns all Lighthouse SEO reports.

Here's some example output. Notice that we don't return the json_report in the response for this endpoint.

{
    "data": [
        {
            "id": 1423,
            "performance_score": 97,
            "accessibility_score": 98,
            "best_practices_score": 92,
            "seo_score": 92,
            "progressive_web_app_score": 30,
            "first_contentful_paint_in_ms": 1851.45,
            "speed_index_in_ms": 1866,
            "largest_contentful_paint_in_ms": 1851.45,
            "time_to_interactive_in_ms": 2473.87,
            "total_blocking_time_in_ms": 123.77,
            "cumulative_layout_shift": 0.01,
            "performed_on_checker_server": "lighthouse-checker-frankfurt-1",
            "issues": [
                {
                    "category": "performance",
                    "actualScore": 97,
                    "notificationThreshold": 99
                }
            ],
            "created_at": "2023-01-14 00:00:55"
        },
        {
            "id": 1321,
            "performance_score": 89,
            "accessibility_score": 98,
            "best_practices_score": 92,
            "seo_score": 92,
            "progressive_web_app_score": 30,
            "first_contentful_paint_in_ms": 294.65,
            "speed_index_in_ms": 328,
            "largest_contentful_paint_in_ms": 294.65,
            "time_to_interactive_in_ms": 1585.48,
            "total_blocking_time_in_ms": 445.9,
            "cumulative_layout_shift": 0.06,
            "performed_on_checker_server": "lighthouse-checker-frankfurt-1",
            "issues": [
                {
                    "category": "performance",
                    "actualScore": 89,
                    "notificationThreshold": 99
                }
            ],
            "created_at": "2023-01-12 23:38:19"
        }
    ],
    "links": {
        "first": "https://ohdear.app/api/sites/1/lighthouse-reports?page%5Bnumber%5D=1",
        "last": "https://ohdear.app/api/sites/1/lighthouse-reports?page%5Bnumber%5D=1",
        "prev": null,
        "next": null
    },
    "meta": {
        "current_page": 1,
        "from": 1,
        "last_page": 1,
        "links": [
            {
                "url": null,
                "label": "« Previous",
                "active": false
            },
            {
                "url": "https://ohdear.app/api/sites/1/lighthouse-reports?page%5Bnumber%5D=1",
                "label": "1",
                "active": true
            },
            {
                "url": null,
                "label": "Next »",
                "active": false
            }
        ],
        "path": "https://ohdear.app/api/sites/1/lighthouse-reports",
        "per_page": 200,
        "to": 2,
        "total": 2
    }
}

Getting a specific Lighthouse SEO report

The /api/sites/{$siteId}/lighthouse-reports/{$reportId} endpoint returns a specific report. You can get the $reportId by retrieving the list of Lighthouse reports (see above)

Here's an example response.

{
    "id": 1,
    "performance_score": 50,
    "accessibility_score": 98,
    "best_practices_score": 92,
    "seo_score": 92,
    "progressive_web_app_score": 30,
    "first_contentful_paint_in_ms": 1851.45,
    "speed_index_in_ms": 1866,
    "largest_contentful_paint_in_ms": 1851.45,
    "time_to_interactive_in_ms": 2473.87,
    "total_blocking_time_in_ms": 123.77,
    "cumulative_layout_shift": 0.01,
    "performed_on_checker_server": "lighthouse-checker-frankfurt-1",
    "json_report": {
        /*
      Omitted for brevity, will contain the full JSON report generated by the lighthouse tool
      */
    },
    "issues": [
        {
            "category": "performance",
            "actualScore": 50,
            "notificationThreshold": 70
        }
    ],
    "created_at": "2023-01-14 00:00:55"
}

Notification destinations

Using our API, you can retrieve notification destination of your site or teams. Because the results of these API calls can contain sensitive values, only admins and team owners are allowed to use them.

Getting the notification destinations of all your teams

The /api/team-notification-destinations endpoint will return all notification destinations defined on the team level for all your teams.

{
  "data": [
    {
      "id": 123,
      "team_id": 1,
      "channel": "mail",
      "destination": {
        "mail": "john@example.com"
      },
      "notification_types": [
        "UptimeCheckFailedNotification",
        "UptimeCheckRecoveredNotification",
        ...
      ]
    }
  ]
}

Getting the notification destinations of a site

To retrieve the notification destinations of a site, you'll need the website ID first.

The /api/sites/{$siteId}/notification-destinations endpoint will return all notification destinations for the site.

{
  "data": [
    {
      "id": 456,
      "channel": "mail",
      "destination": {
        "mail": "john@example.com"
      },
      "notification_types": [
        "UptimeCheckFailedNotification",
        "UptimeCheckRecoveredNotification",
        ...
      ]
    }
  ]
}
Was this page helpful?

Feel free to reach out via support@ohdear.app or on Twitter via @OhDearApp if you have any other questions. We'd love to help!