Performance degradation on Oh Dear, a post mortem
Published on July 26, 2025 by Mattias Geniar

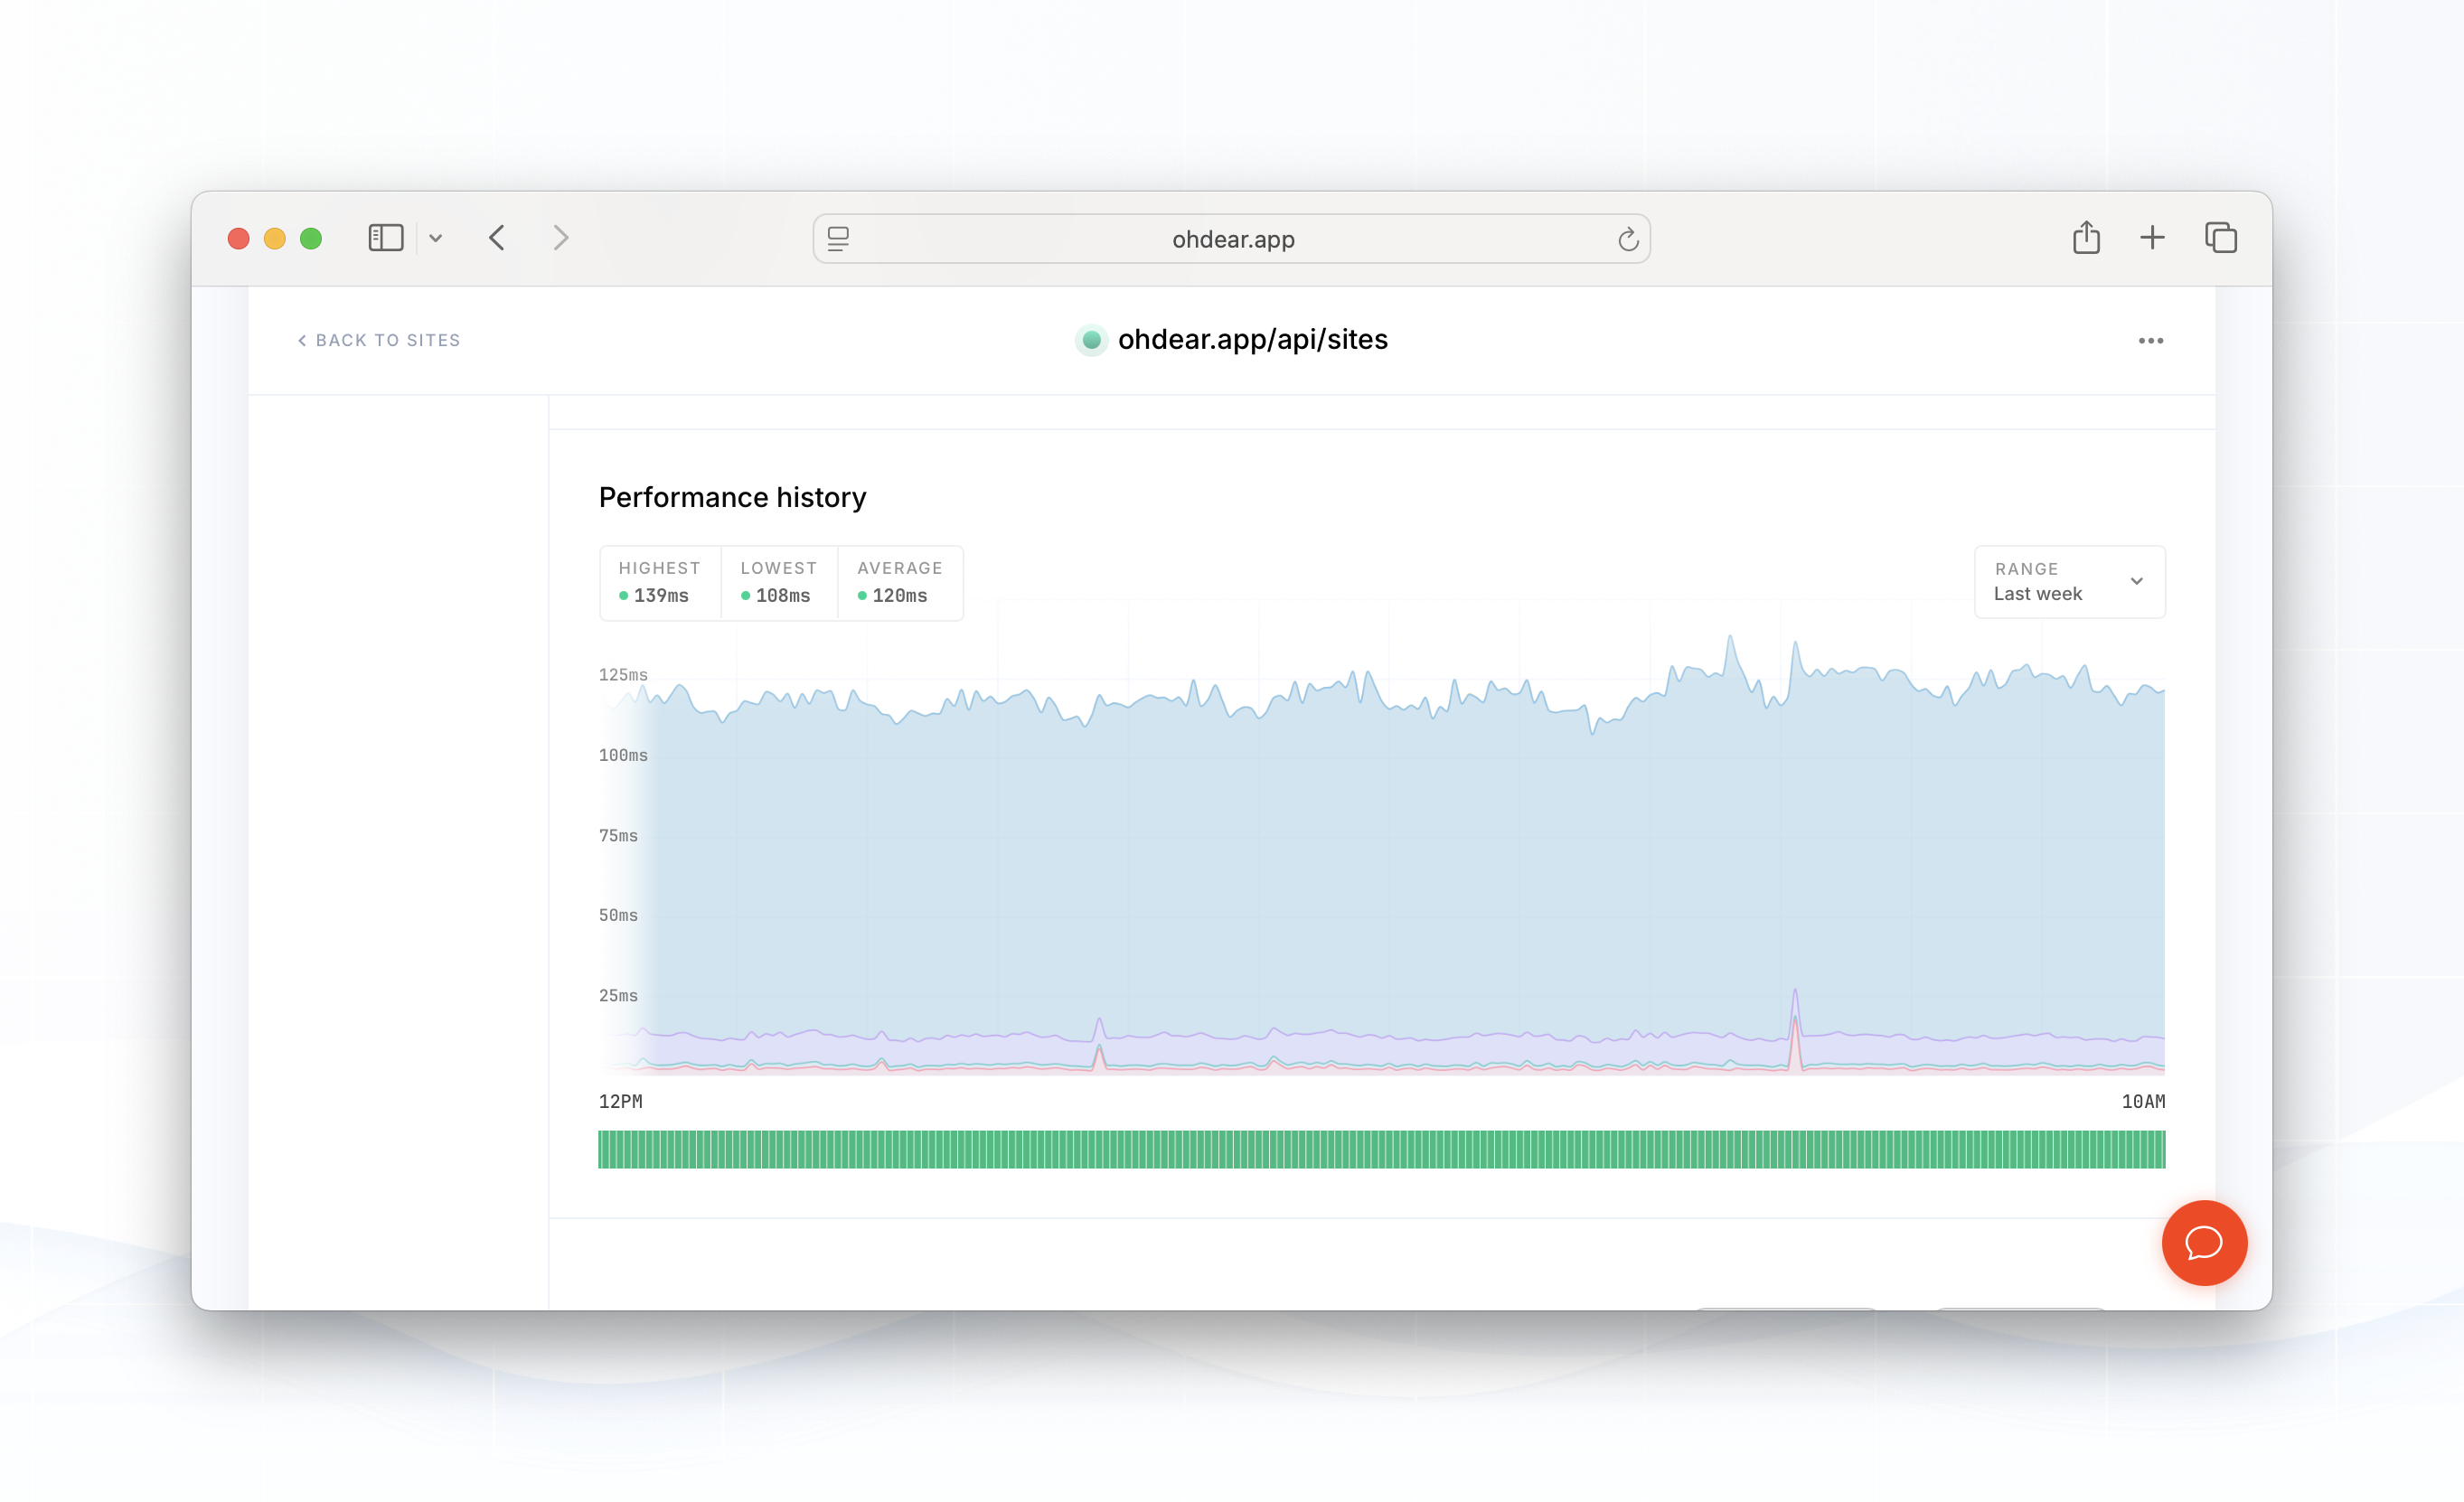
On Tuesday the 22nd of July around 09:00 UTC, our users have experienced a slower-than-usual website, API and application. This continued until the next day, July 23rd and was ultimately resolved around 17:30 UTC.
This post highlights the cause and the fix we've applied. There were several misleading metrics that caused this issue to last longer than we'd have expected that make for an interesting retrospective.
As is always the case when debugging: sometimes it's hard to distinguish cause from effect when looking at metrics.
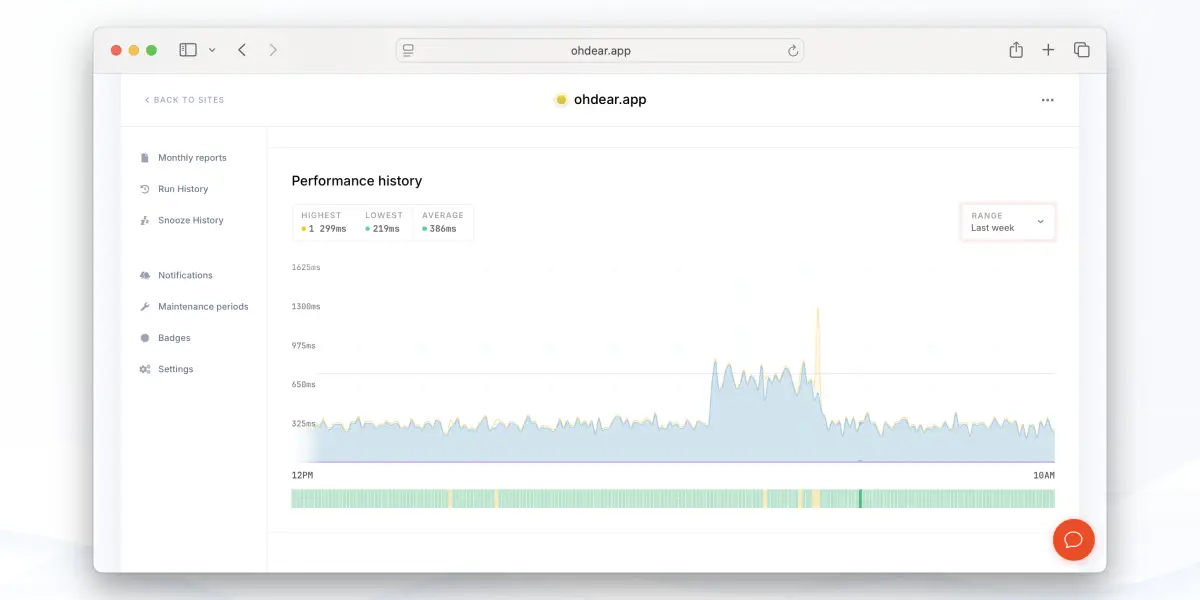
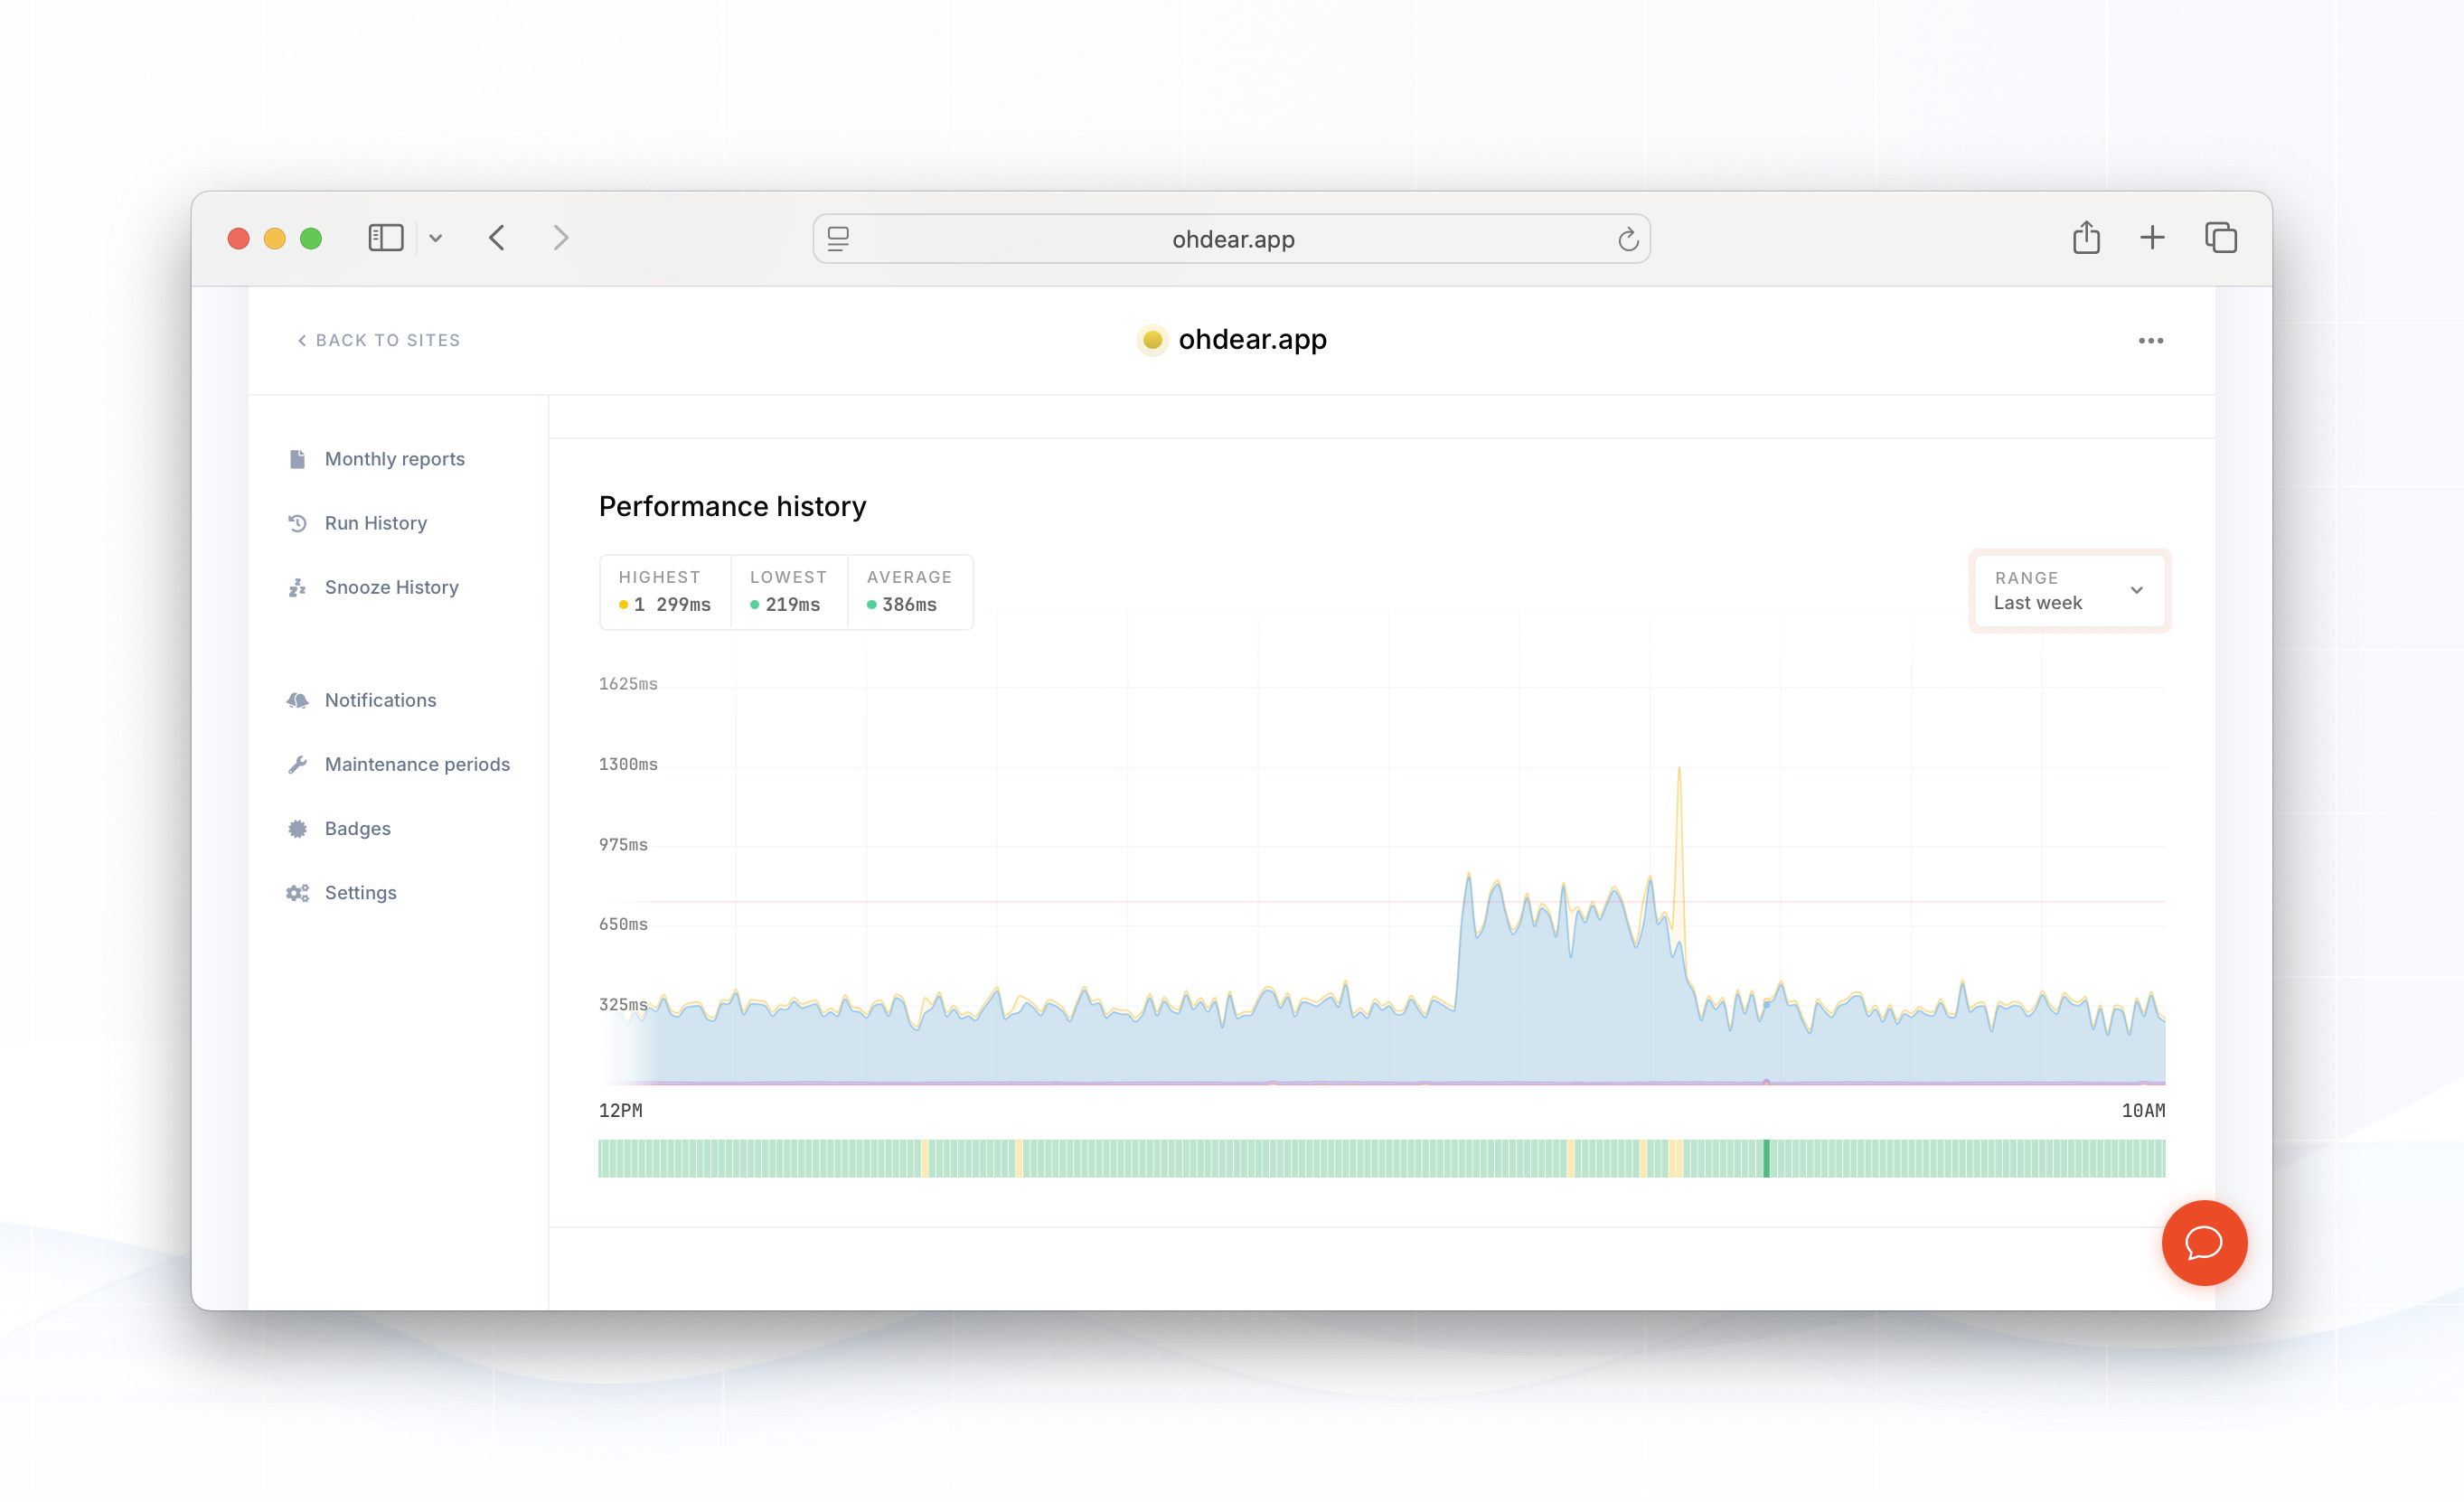
The issue: slowdowns in application #
Without a seemingly clear cause, our website & API started to experience signifant slowdowns. There were no deployments, configuration or infrastructure changes at that time - in fact, the team was in the middle of our weekly standup/huddle at the time it started.
 We monitor several different endpoints, the problem was only noticeable on authenticated endpoints or routes that actually touched our database - the PHP-only endpoints (such as naked API calls without authentication) showed stable performance.
What did our Zabbix monitor tell us? #
Internally, next to using Oh Dear to monitor Oh Dear, we also use an isolated open source system called Zabbix. This is our independent set of eyes on our infrastructure and looks at the internals, like CPU, memory & disk usage, as well as details on MySQL throughput, Redis usage, etc.
This is where we were thrown off-track.
Below we show our CPU load, CPU usage and MySQL throughput of our MySQL server.
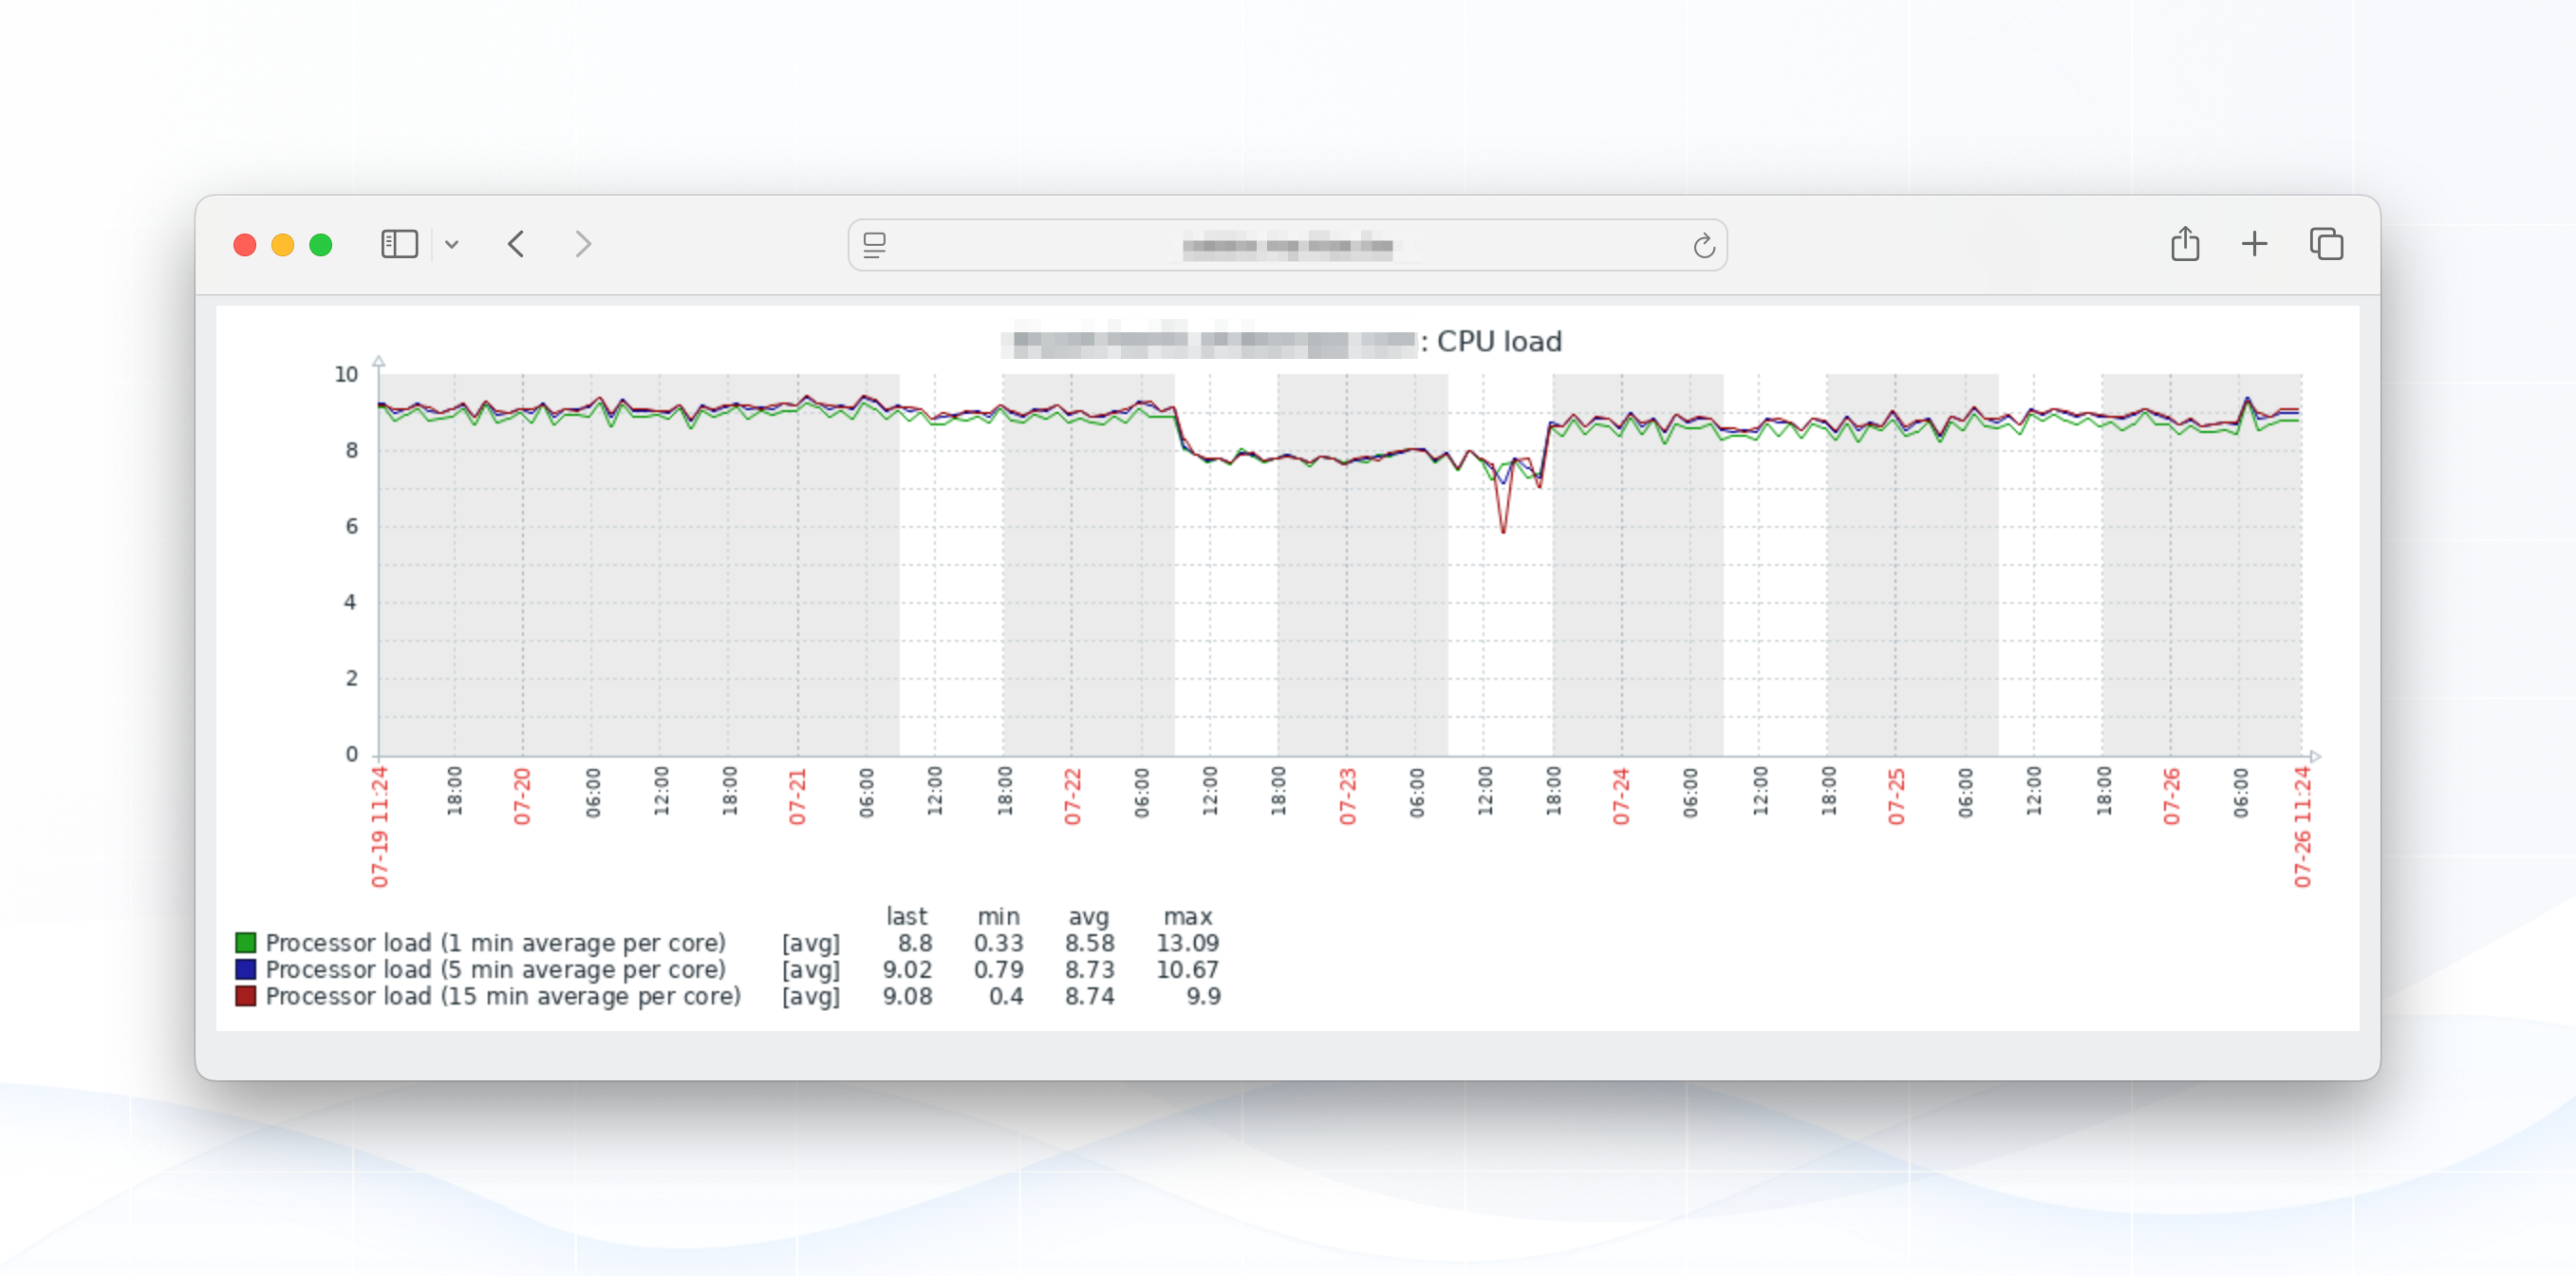
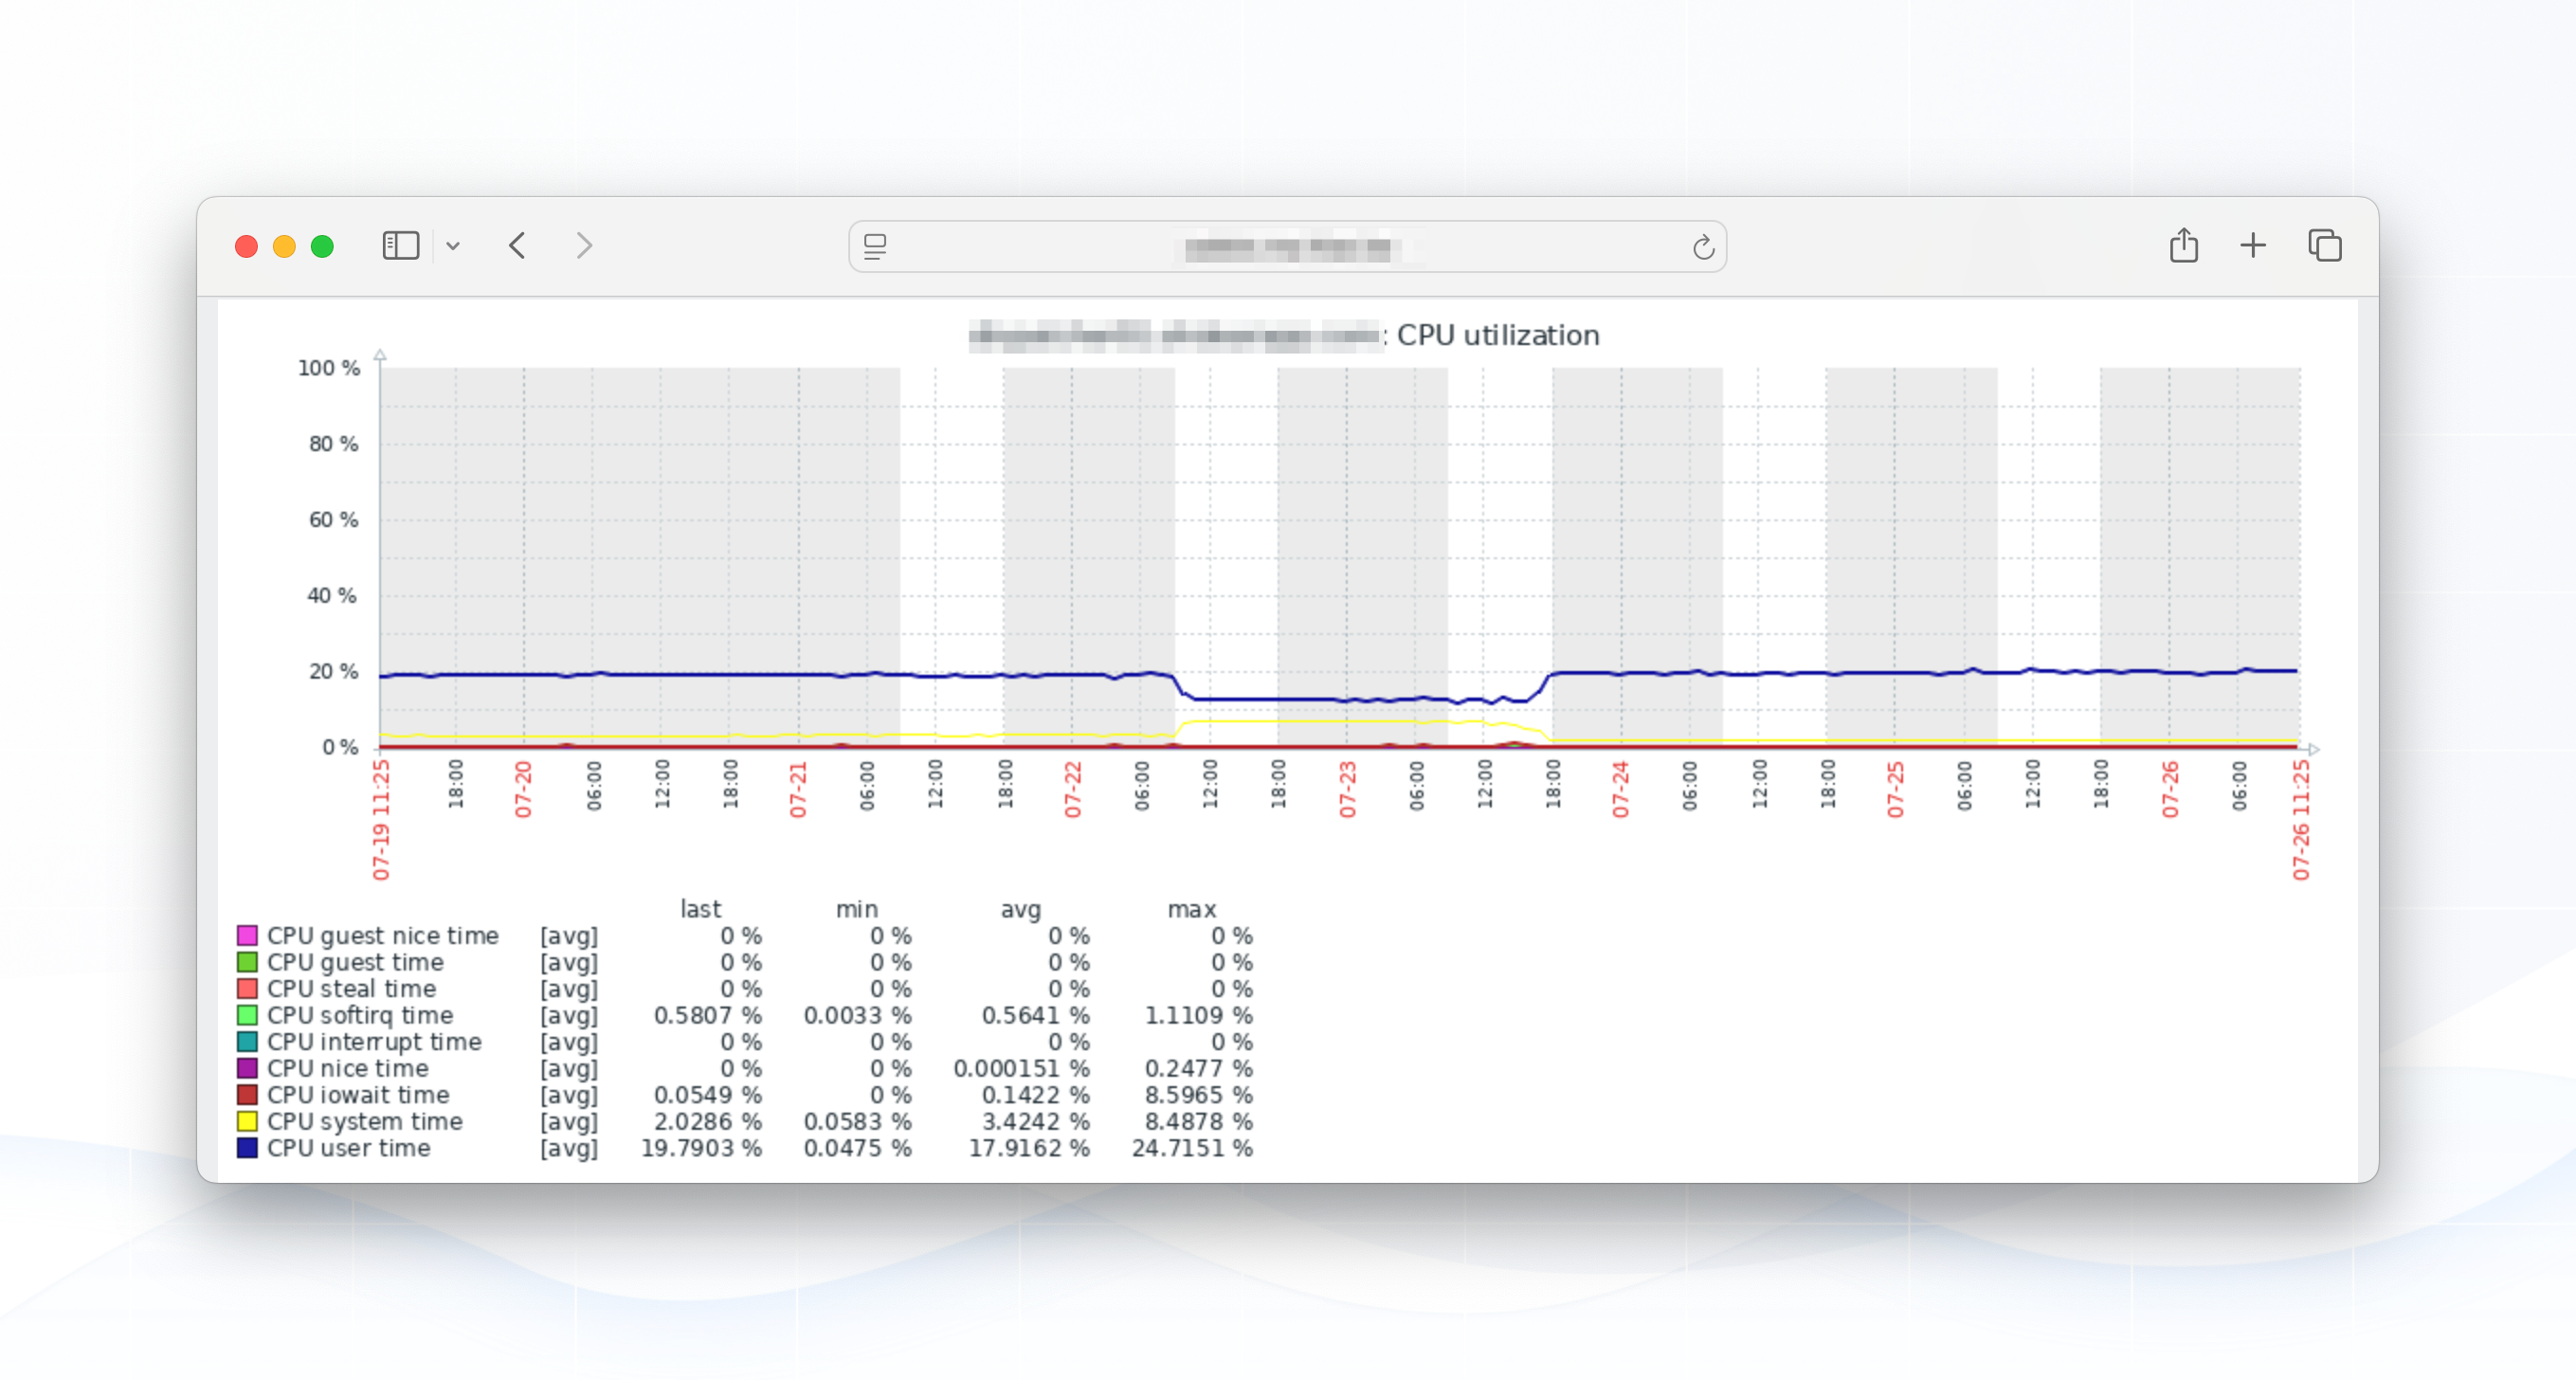
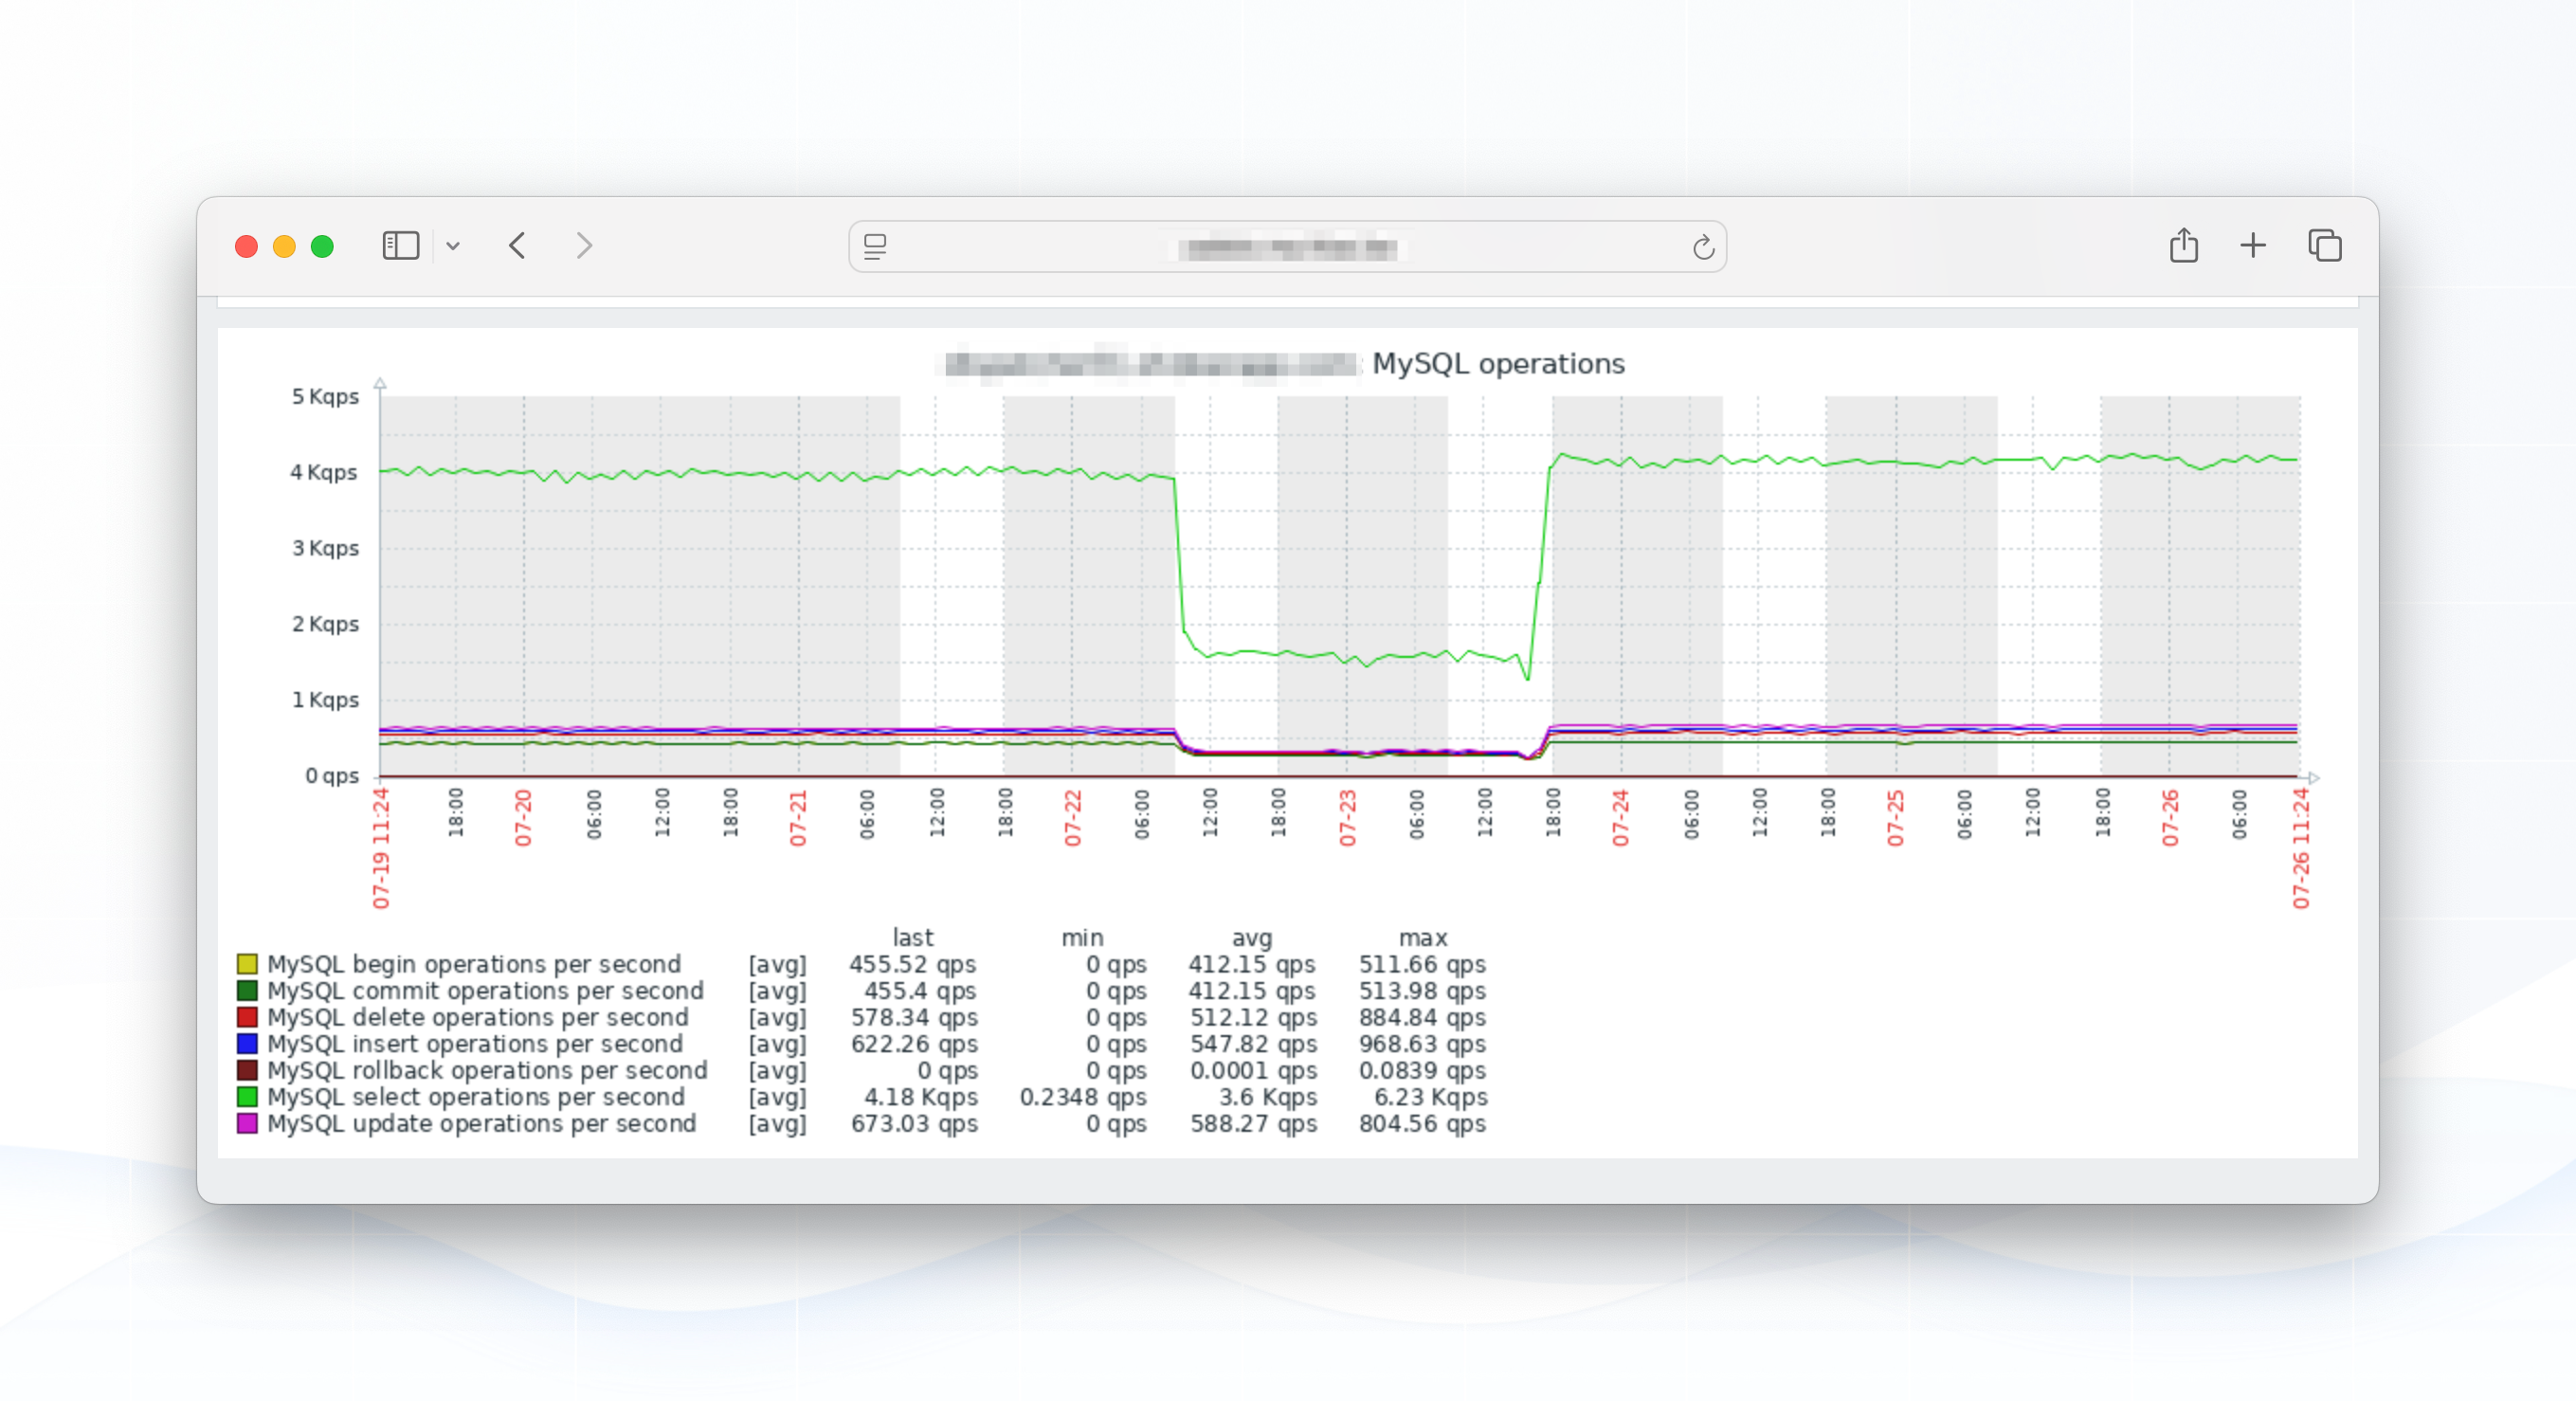
Clearly, we had an issue: MySQL throughput (the top green line = SELECT's per second) fell off a cliff. CPU load and CPU time showed a noticeable, but in comparison to the SQL throughput difference - rather small, drop.
Our first train of thought was: the cause is on the application side, we're sending less SQL queries to our database server, so the cause is either;
- Slower-than-usual processing of PHP jobs (looking at: Horizon, PHP-FPM)
- Slower-than-usual network traffic between our main servers & MySQL (looking at: network throughput, firewalling, connection limits)
- Faulty hardware: a failing RAID setup, a failing memory bank, ...
None of these proved to be the cause, there were no anomalies and we could confirm & verify that we tried to process all requests at the same speed, but were being slowed down by MySQL queries.
Enter, CPU jumps #
Having excluded the most common suspects, we dived deeper and focussed the search entirely to MySQL itself. That's when this metric jumped out - pun intended.
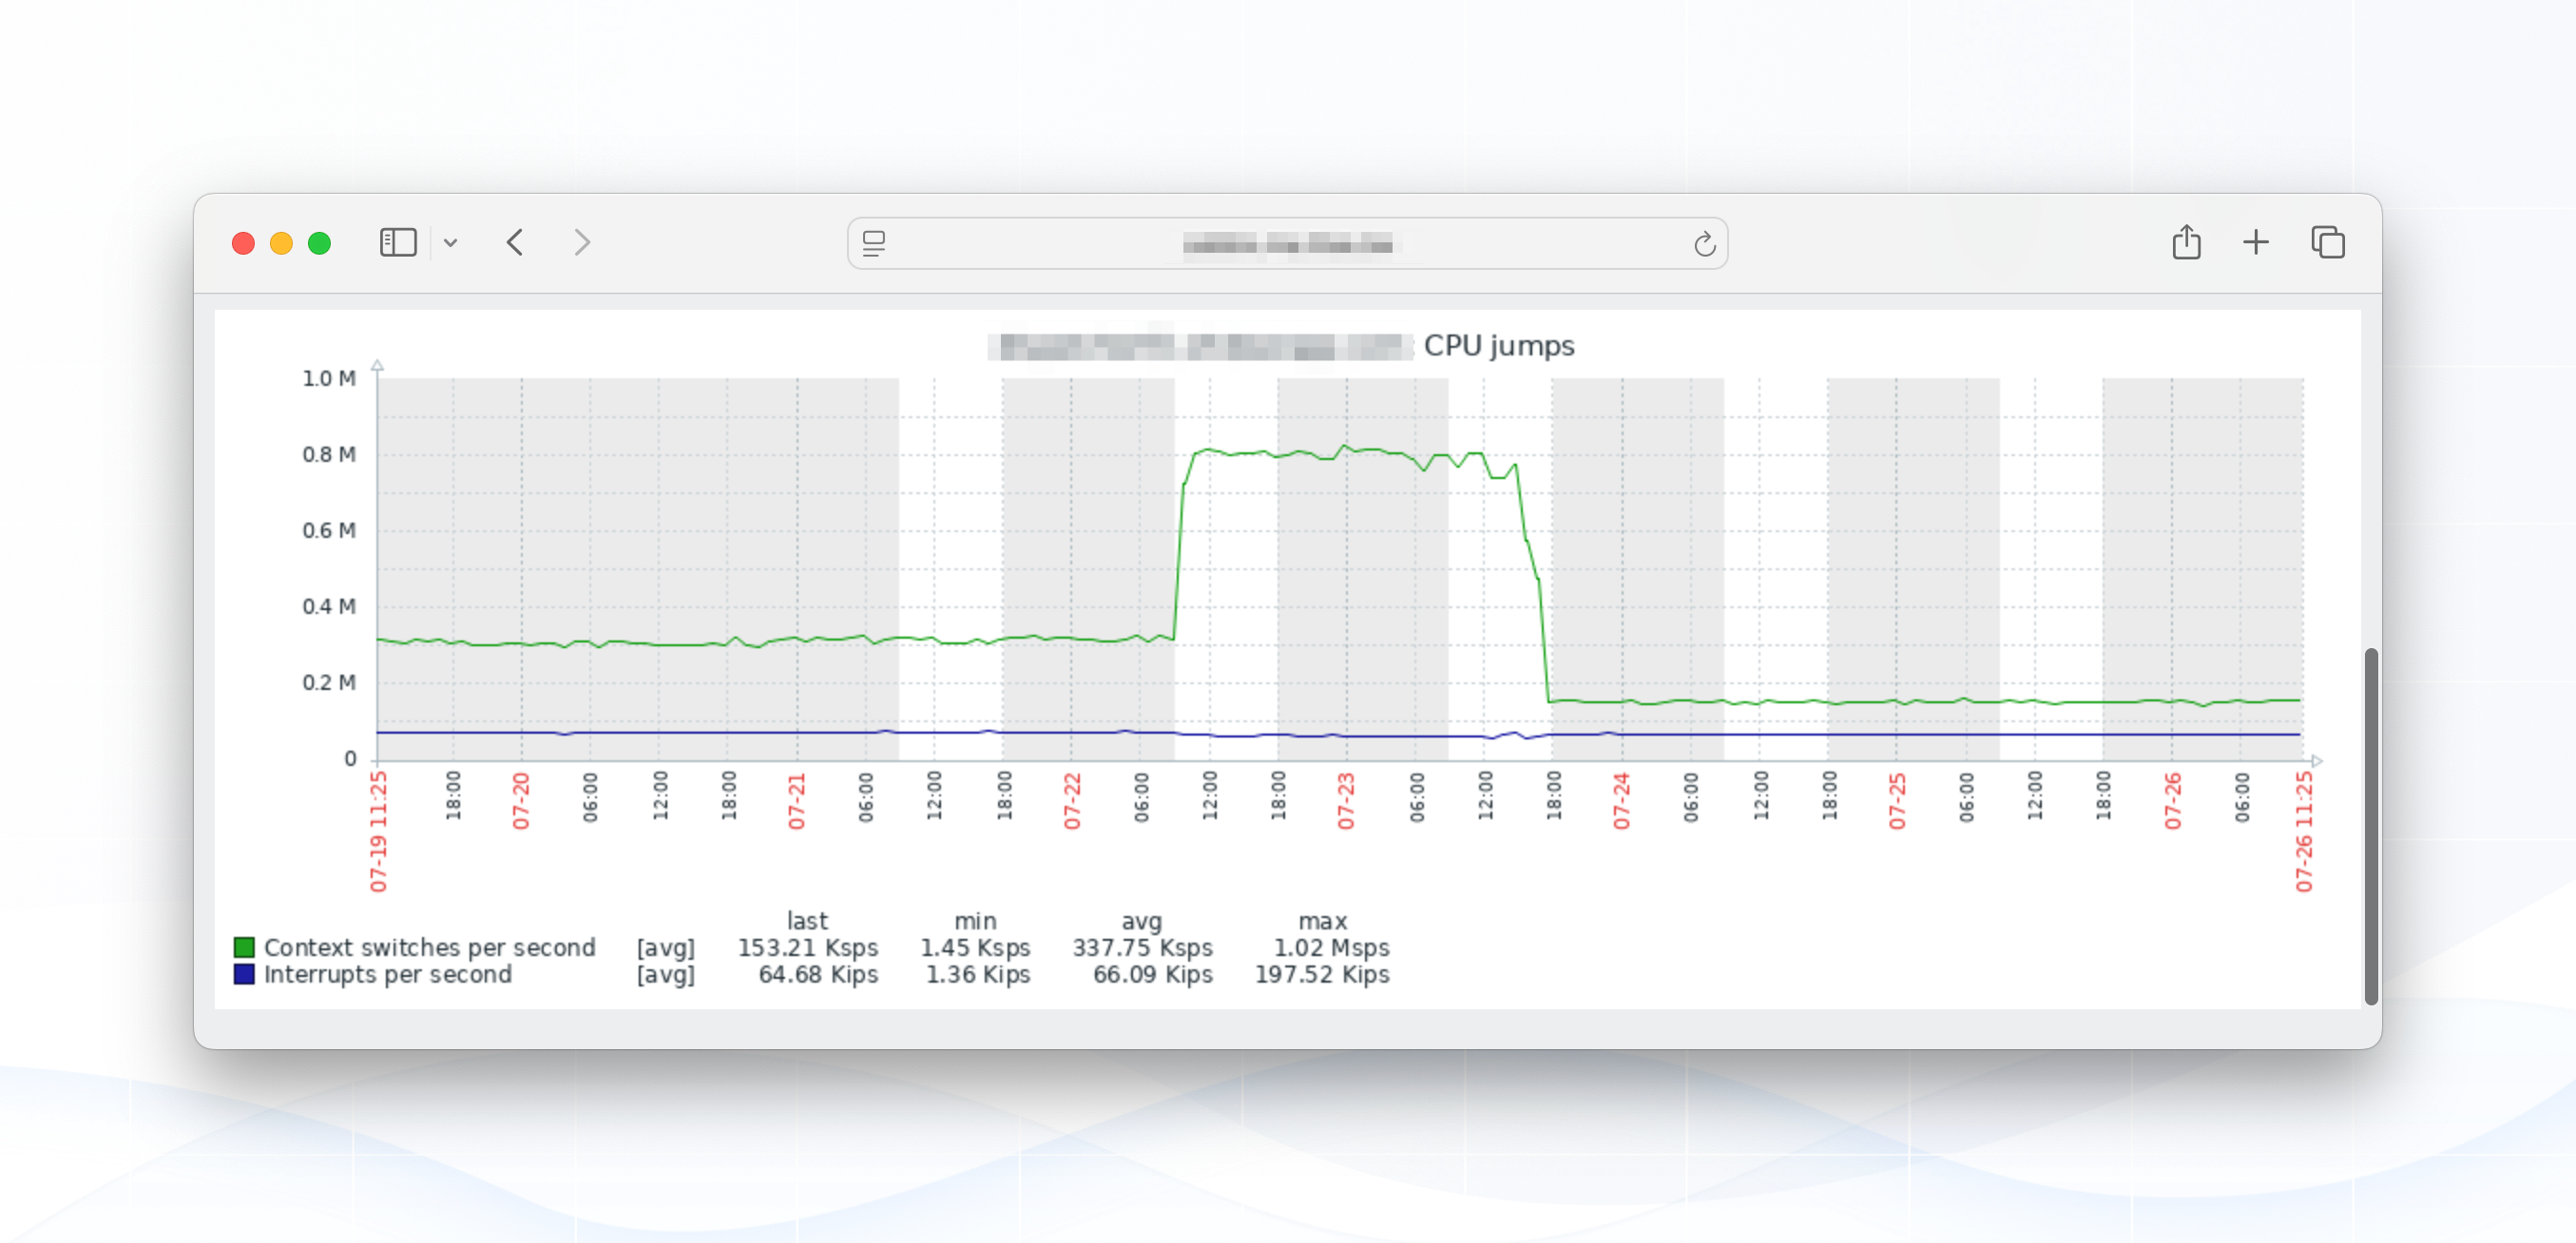
On Linux, CPU jumps - typically referring to sudden spikes in context switches - can be caused by a variety of factors related to how the kernel schedules processes and handles interrupts.
Excessive I/O operations (disk or network), frequent system calls, or user-space programs making short-lived kernel interactions can force more context switches. Interrupts from hardware devices (IRQ) and soft interrupts (softirq), especially in high-throughput environments, further contribute to this, as they demand the CPU’s attention and force it to switch context from user processes to kernel handlers and back.
At first, this lead us back to the hardware side: rate limiting on the physical switch between the servers (causing time-waits on the network), faulty hardware, ... But these were all already excluded earlier.
MySQL queries impacting CPU jumps #
As we switched our own context back to MySQL itself, we noticed a single query taking ~1 second to execute. In and of itself not the biggest of issues (especially if they are one-offs), but these were recurring:
SELECT
	*
FROM
	`ping_endpoint_monitor_uptime_periods`
WHERE
	`started_at` <= '2025-07-23 15:29:01'
	AND `ended_at` >= '2025-07-23 15:29:01'
LIMIT
	1
Now for a bit of context: when we're performing our scheduled task monitoring, we receive incoming ping's to our ping.ohdear.app endpoint. This hits AWS, gets queued there, and we pick up the queue to process all incoming requests. AWS handles the peak load, we see a steady load of incoming messages via AWS SQS.
To avoid false alerts, we monitor this ping endpoint ourselves: besides all the usuals to monitor (like https, ping, tcp, ...) we also send a ping callback of our own every 4 seconds, and expect this to be processed and handled within the next 4 seconds. If that's not the case, we fire off some internal alerts and mark the ping endpoint as being down.
This way, we can keep the uptime of our ping endpoint in mind when processing and sending out alerts: if our ping endpoint was down, we shouldn't send a "Your scheduled task didn't run"-notification, it might have still run, but the pingback didn't receive us.
All that data is stored in in our ping_endpoint_monitor_uptime_periods table, with a simple structure:
CREATE TABLE `ping_endpoint_monitor_uptime_periods` (
	`id` bigint UNSIGNED NOT NULL AUTO_INCREMENT,
	`started_at` TIMESTAMP NULL DEFAULT NULL,
	`ended_at` TIMESTAMP NULL DEFAULT NULL,
	`created_at` TIMESTAMP NULL DEFAULT NULL,
	`updated_at` TIMESTAMP NULL DEFAULT NULL,
	PRIMARY KEY (`id`),
	KEY `started_ended_index` (`started_at`, `ended_at`),
) ENGINE = InnoDB AUTO_INCREMENT = 1 DEFAULT CHARSET = utf8mb4 COLLATE = utf8mb4_unicode_ci
Over time, this table grew - we didn't prune it - and it looks like MySQL can be stressed when executing date queries on a large table, to the point where it exceeds a certain threshold and becomes incredibly inefficient at executing that same query.
There were no sudden increases in the table size, but it did contain 50k+ rows accumulated over time. By all accounts, it looks like we exceeded a certain size that either prevented the table from fitting in memory (unlikely, as it's still super small) or it forced a different query execution logic (possible, but hard to verify).
The result was: a massive jump in context switches as measured by CPU jumps and a very noticeable decrease in SQL throughput, all caused by queries that went from ~25ms in execution to jumping to > 1s. That longer query time didn't spike CPU usage (which you would expect), but spiked the context switches which slowed down all other CPU usage.
The fix #
In hindsight, the fix is easy: prune the table (we don't need records > 1 day old).
DELETE FROM `ohdear`.`ping_endpoint_monitor_uptime_periods`
WHERE
	(`started_at` < '2025-07-20 00:00:00')
What we didn't expect was the real cause to be so hidden by misleading metrics.
Avoiding this issue in the future #
Since this short-term fix, we've implemented daily pruning of the table to delete the old - unneeded - records.
In closing #
It can be very frustrating to see that a fix to a (for us at least) long period of performance issues can turn out to be so simple.
Like we mentioned at the top: when debugging, it can be hard to distinguish what is the cause of the problem vs. what is just a side effect of the problem.
I've never before experienced a MySQL server with lower CPU usage, lower CPU load and lower SQL throughput to be caused by a query. If anything, I'd assume the CPU usage and load to increase in such a scenario - which completely threw me off.
The fact that the problems appeared without clear human cause by us (a certain threshold in MySQL exceeded?) and that the initial metrics didn't make a lot of sense (slower SQL throughput, lower CPU usage on MySQL) lead us in the wrong direction first.