Why we will be making breaking changes in our API soon
Published on July 24, 2025 by Freek Van der Herten

In a few weeks, on Tuesday 26st August, we will be deploying breaking changes to our API. In this blog post we want to share why and how we'll do this.
If you're using our API, here are the upgrade instructions.
Introducing Ping and TCP Port monitoring #
A few weeks ago, we sent a survey out to all our users asking what they like about Oh Dear, how they use it, and how we could improve our service. If you didn't get it, you can still fill out our survey. It only takes a couple of minutes.
Currently, we can monitor the uptime of any HTTP(s) site. In our survey, our users mentioned that they'd like to use Oh Dear to also monitor MySQL, email, Redis, or any other kind of server.
That's why we're working on adding ping and TCP monitoring. Instead of performing a simple GET request, Oh Dear will be able to send a Unix ping command to a server, and to open up a TCP port to any server you'd like, and send a command through it.
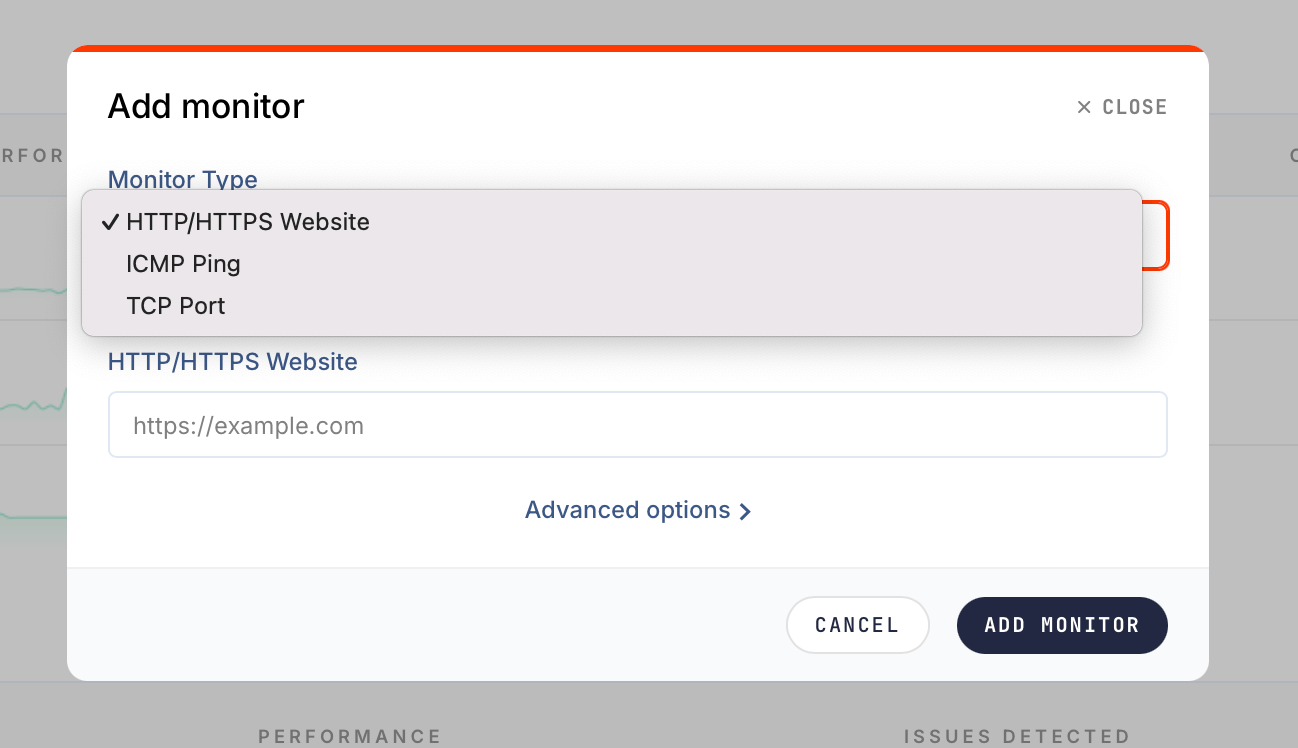
When adding a site to monitor to Oh Dear you will be able to select the type (we'll make this choice much prettier than a simple dropdown when we ship this feature).
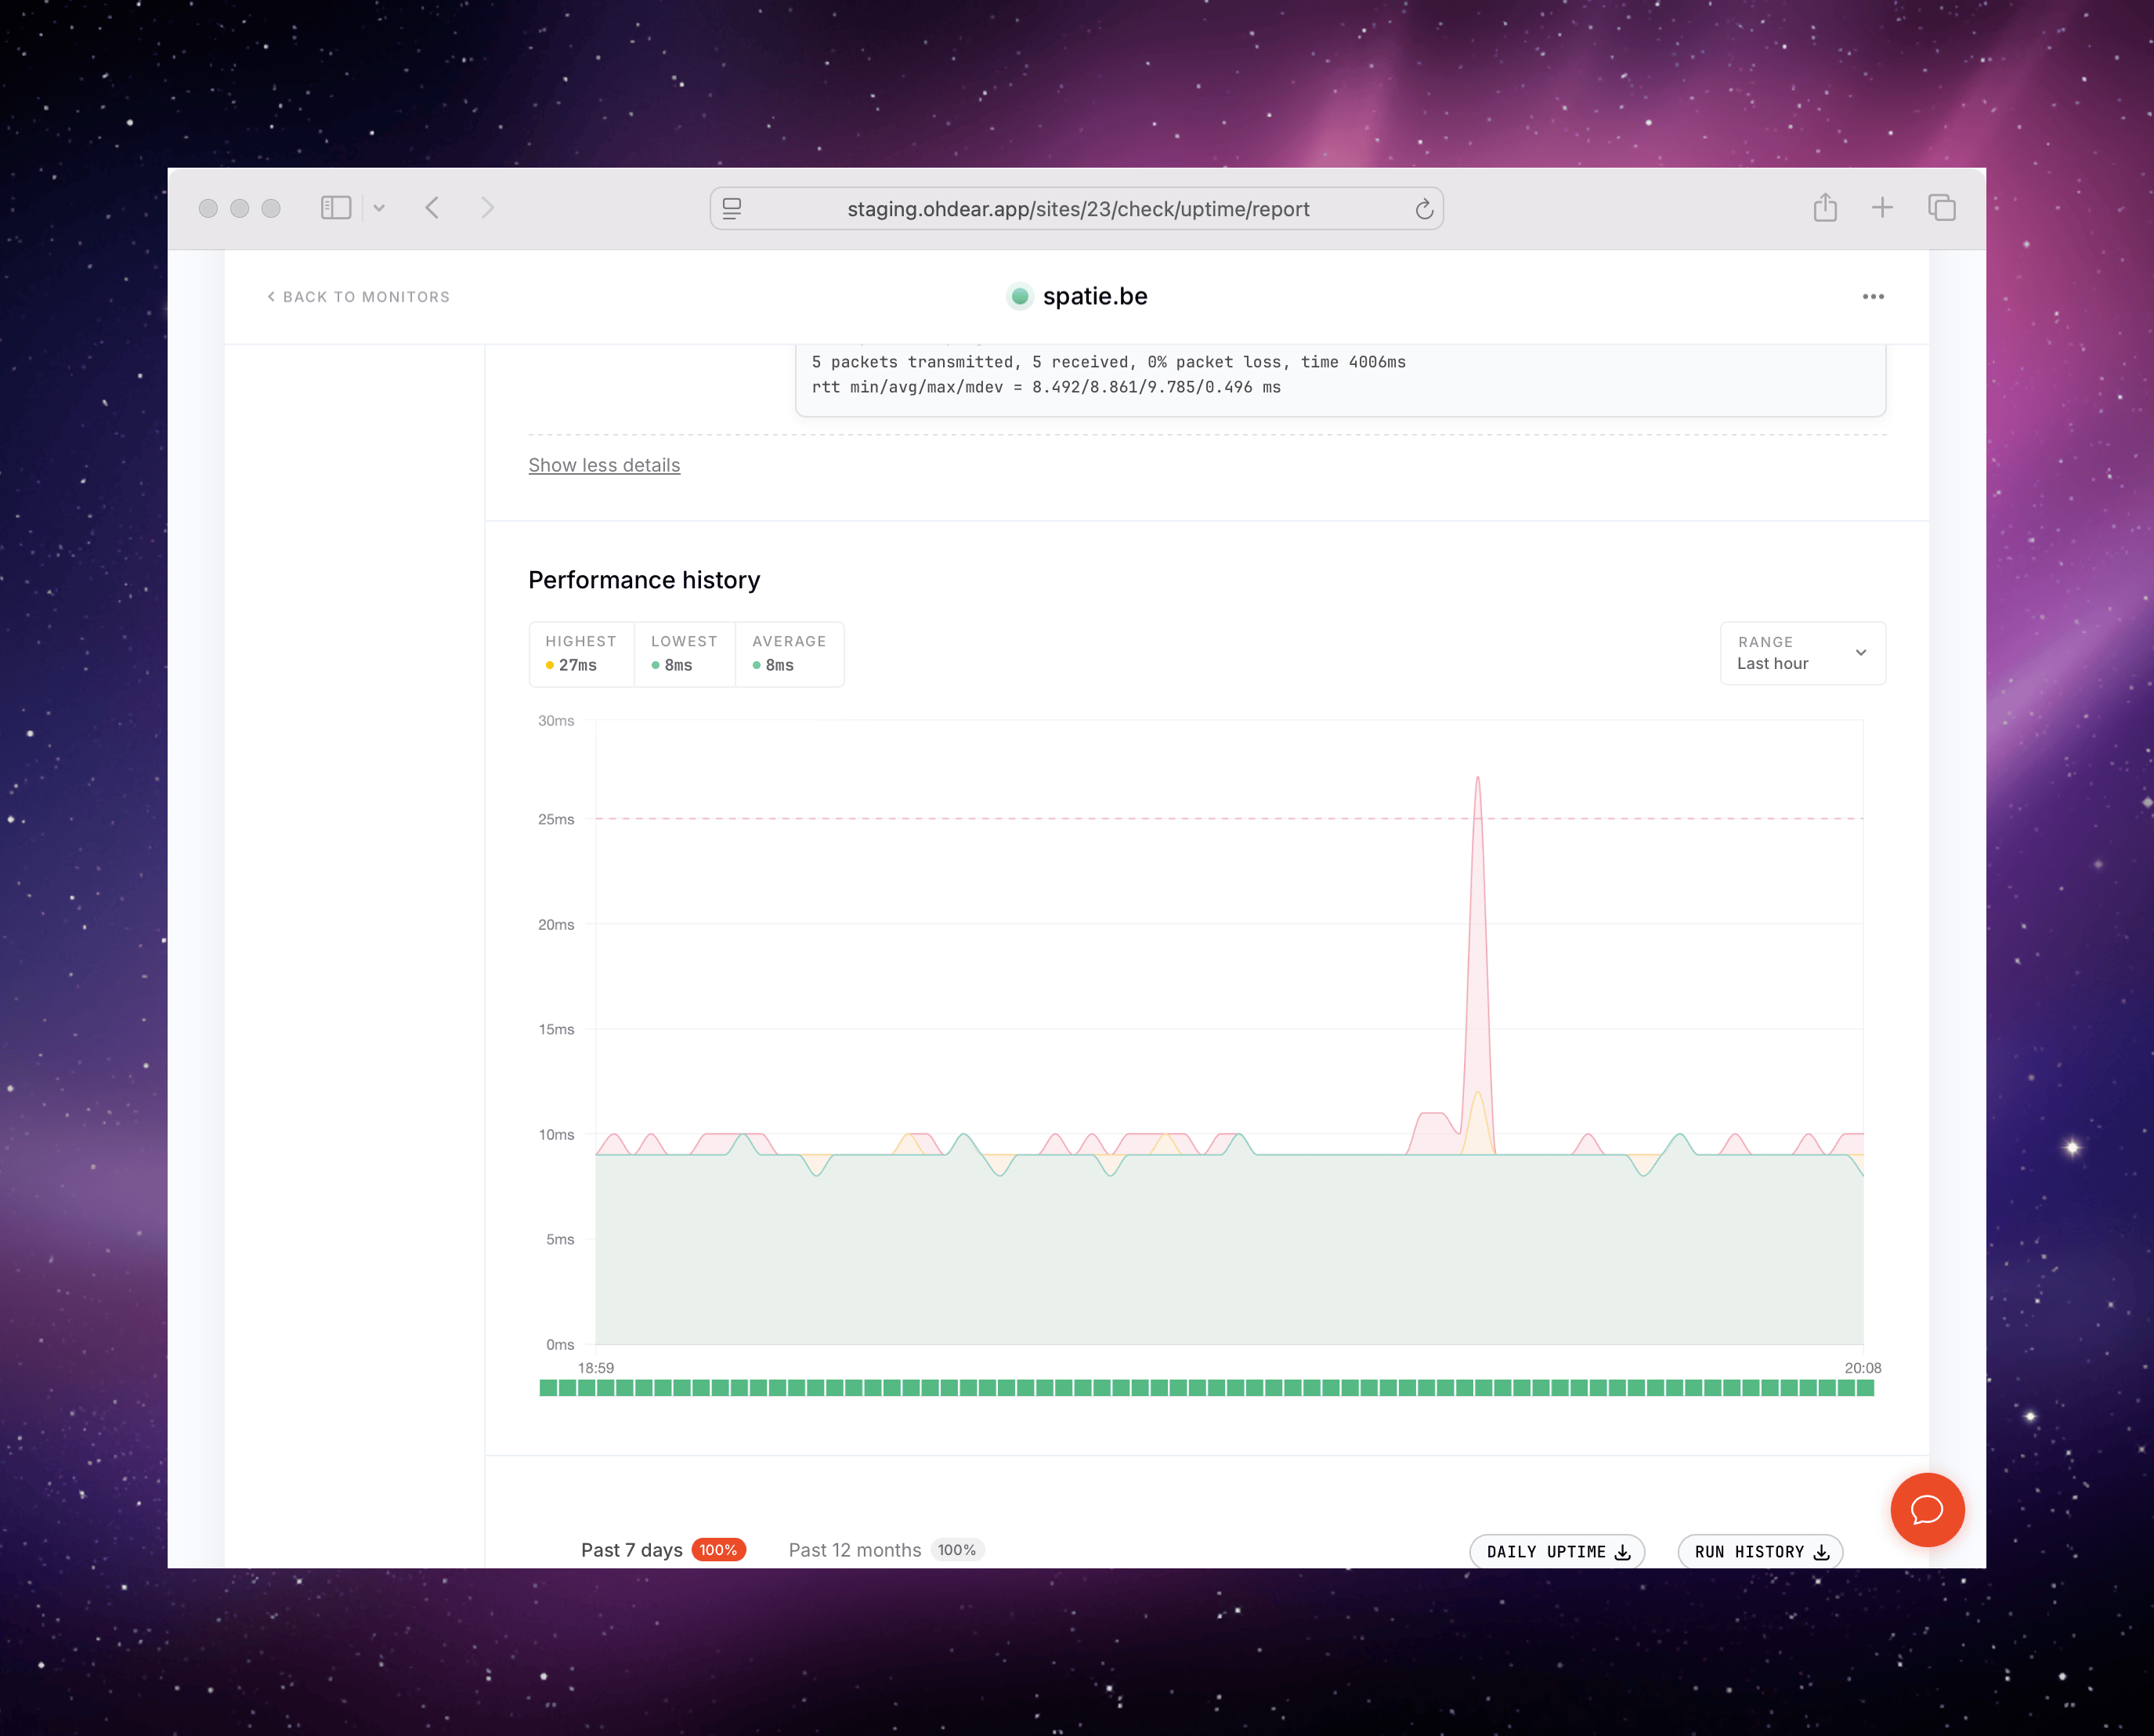
We already have ping/TCP checks running in our staging environment. Here's how ping results look like.
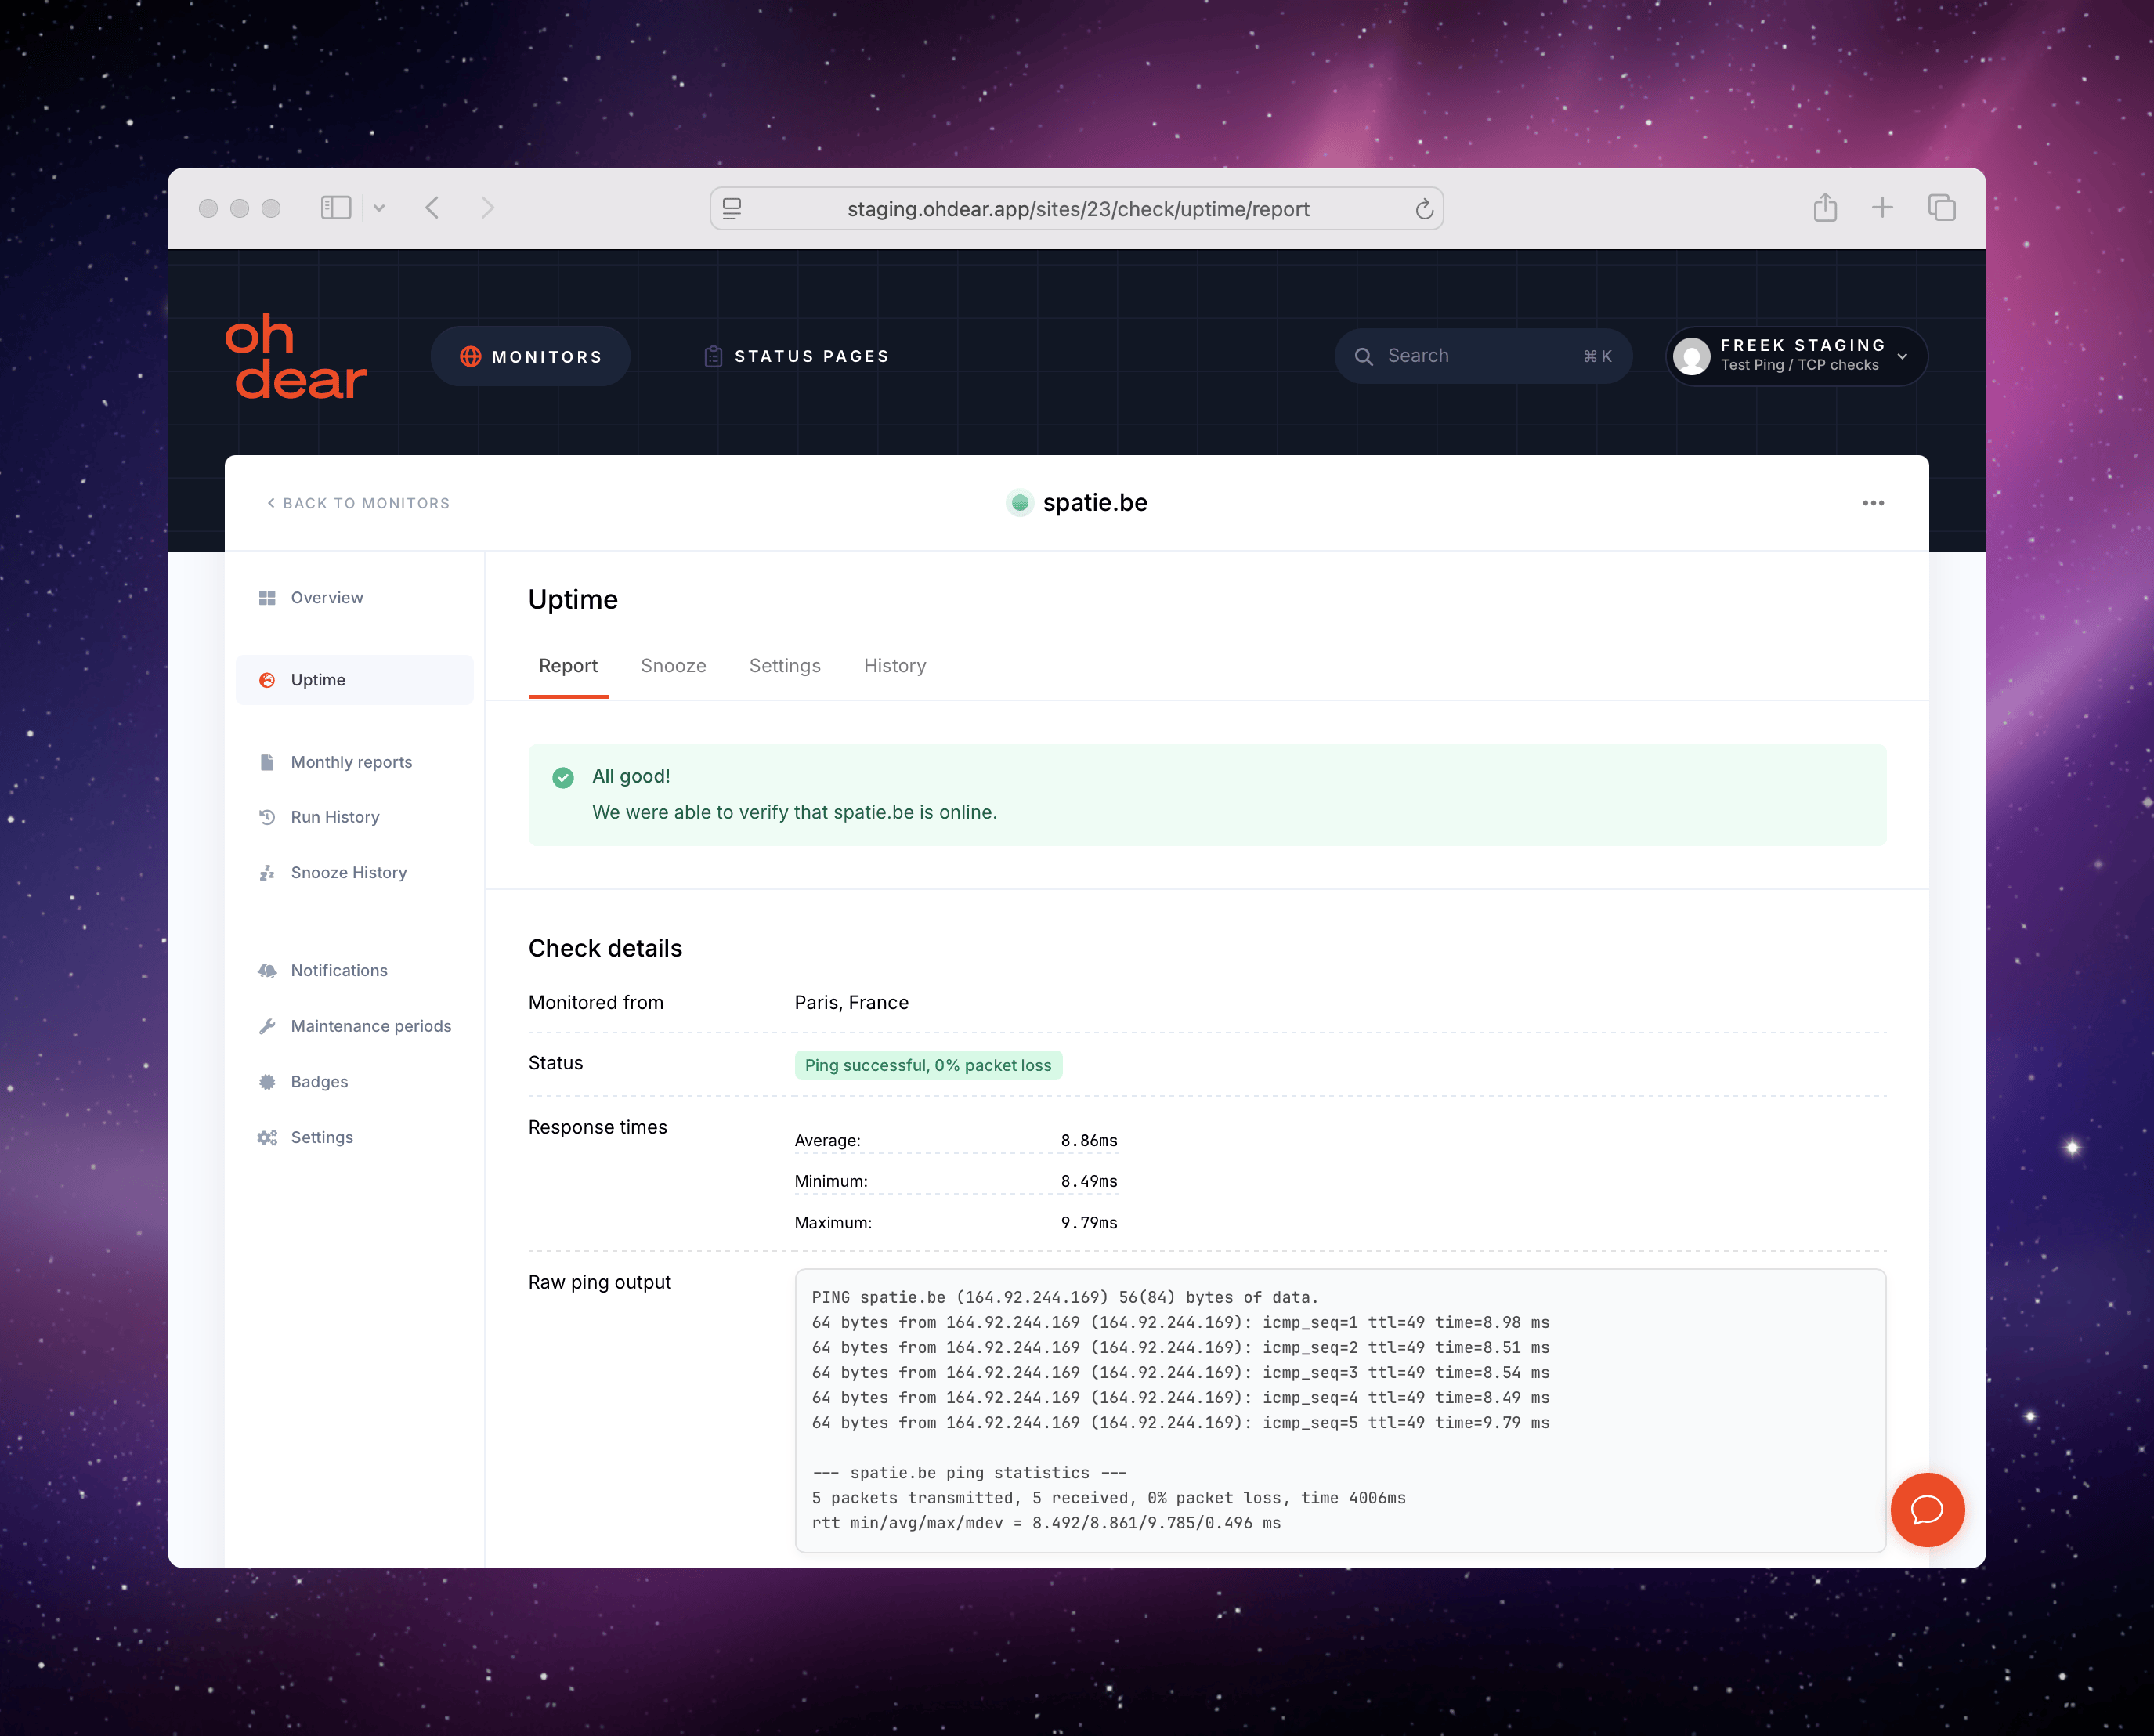
Of course, we'll also record performance data, which will be shown on that page as well when scrolling down.
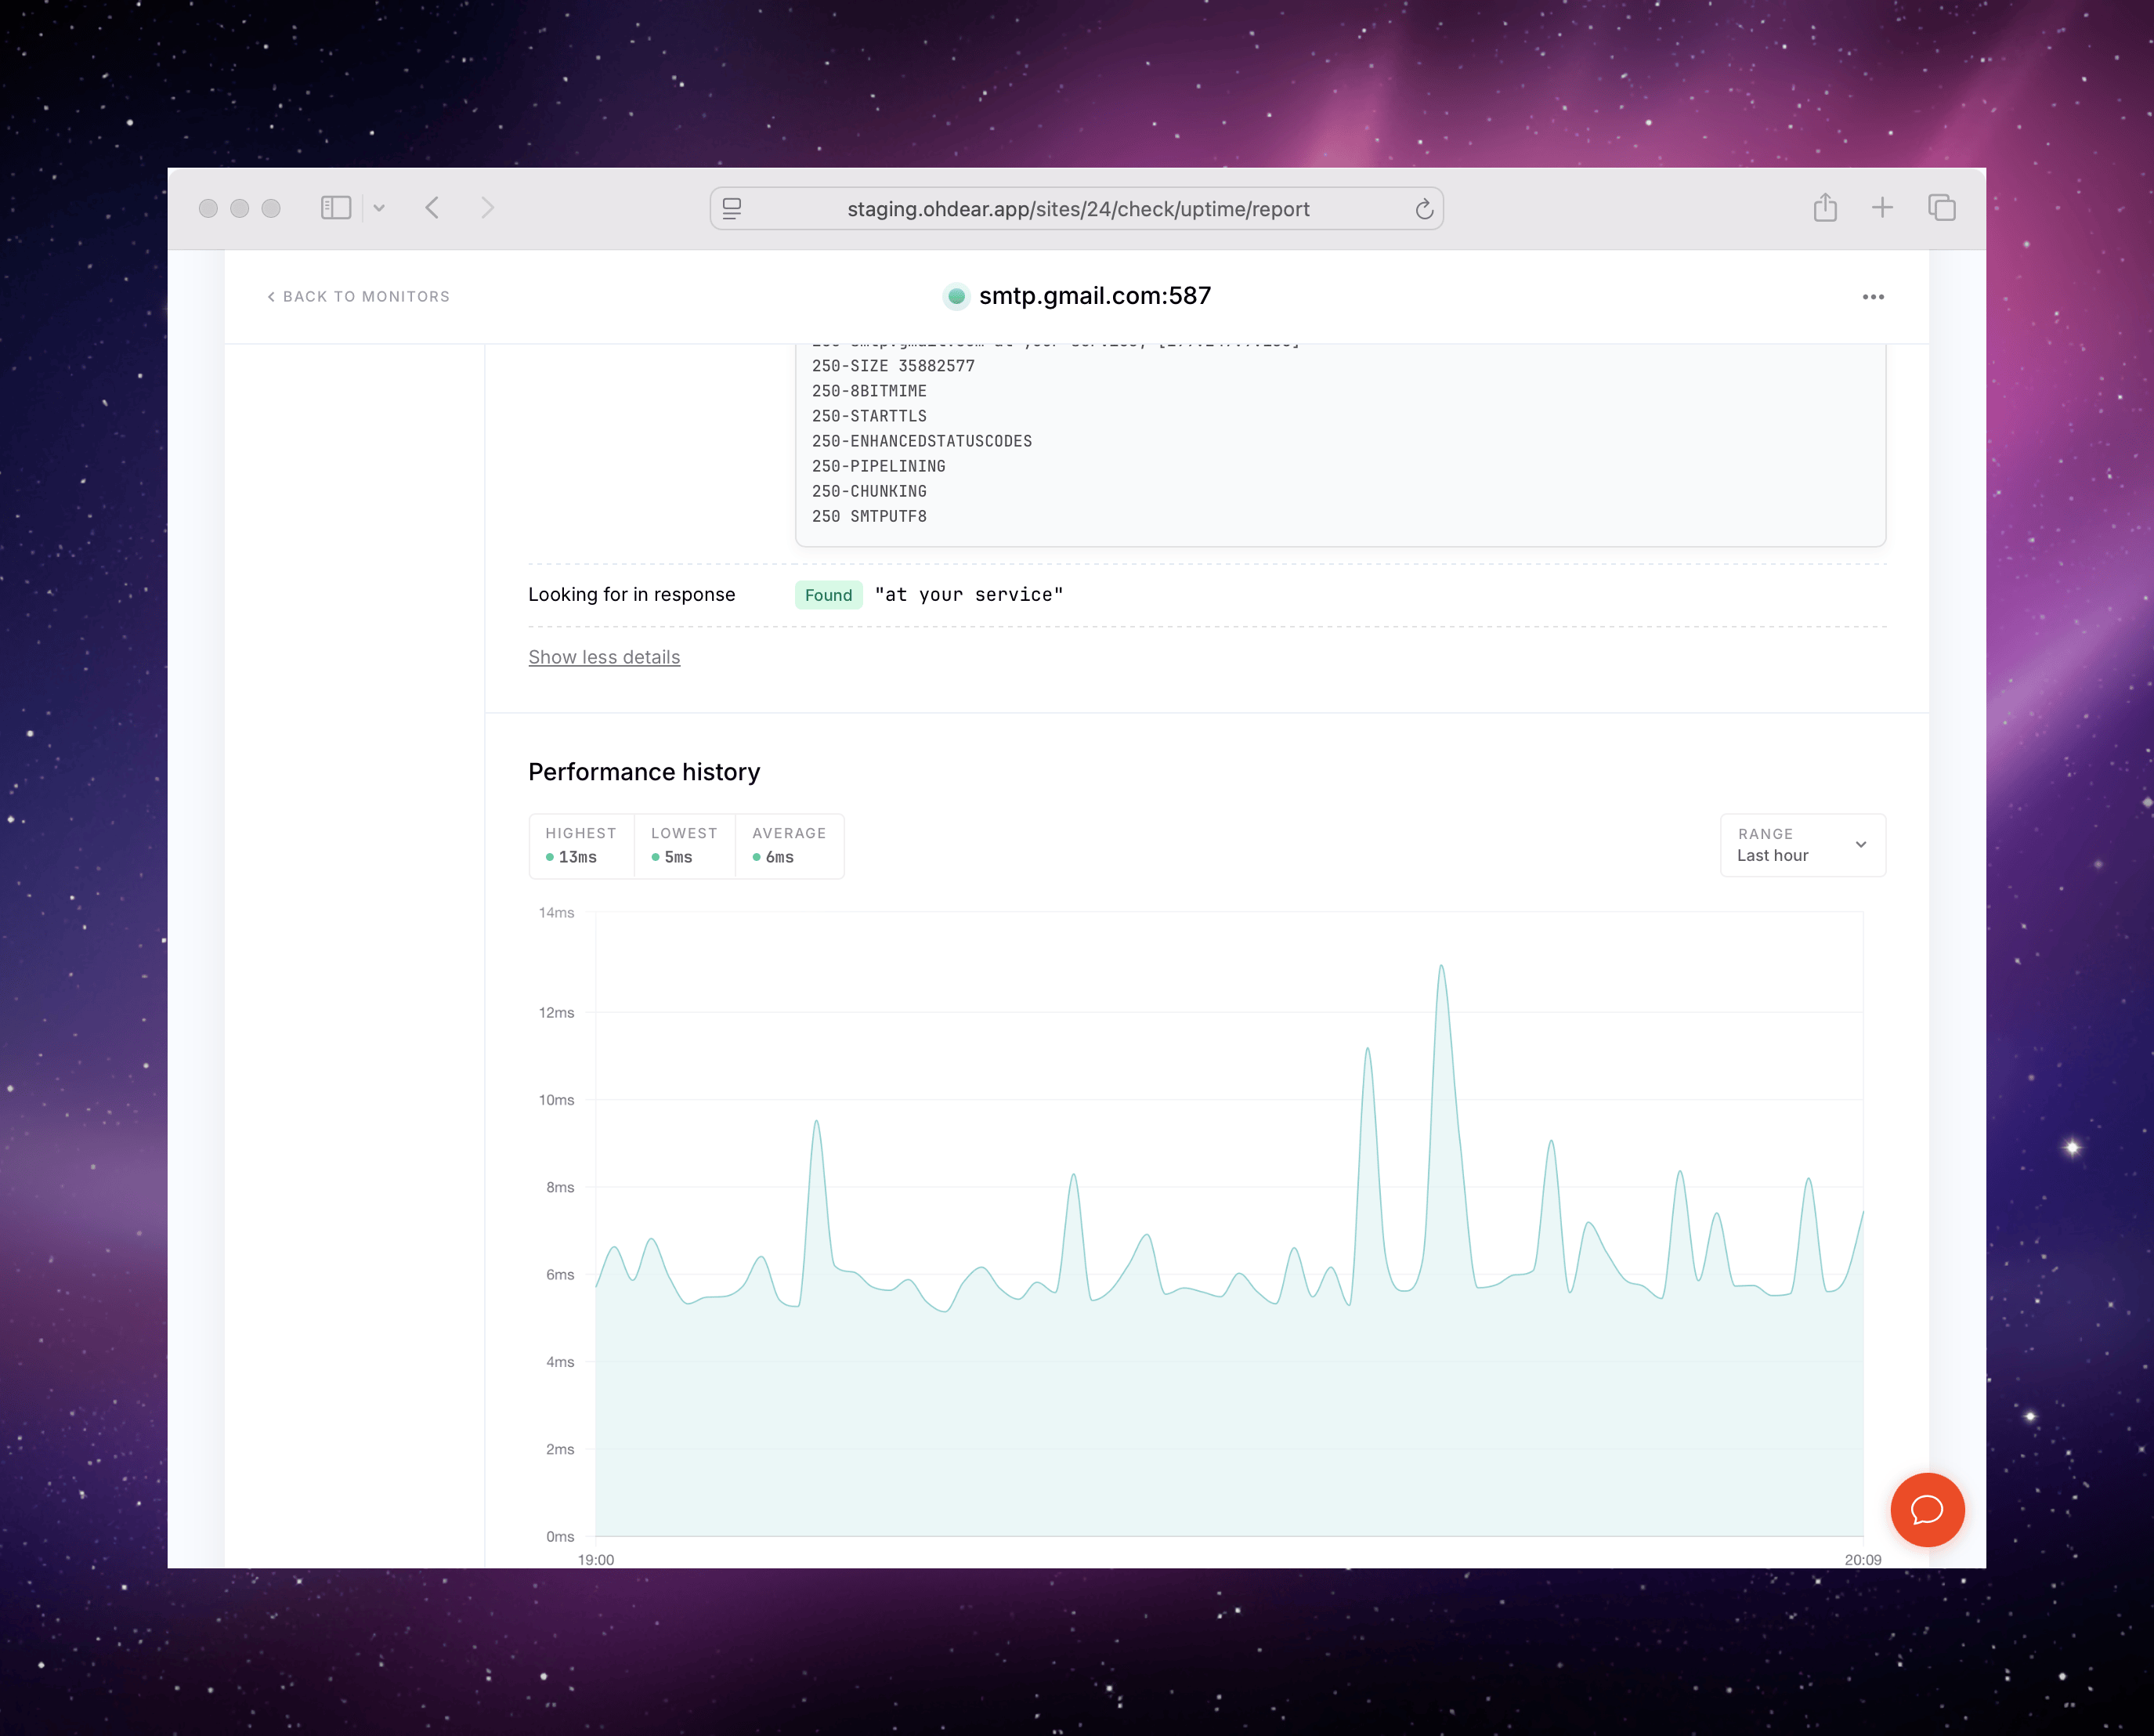
And here's an example of TCP results.

For TCP checks, we'll also record connection time and dislay a graph for those times.
Naming things is hard (why we are breaking our API) #
Since Oh Dear started, we always had the concept of a "Site" you're monitoring. But the name "Site" is really weird when you change the checking type to ping or TCP. For example, when checking the uptime of a port of a server, you're not really checking a "Site".
That's why we made the hard choice of renaming the "Site" concept in Oh Dear to "Monitor". A monitor will have a type:
- HTTP: for checking websites
- Ping: for checking websites and servers via Ping
- TCP: for checking the connectivity of a port
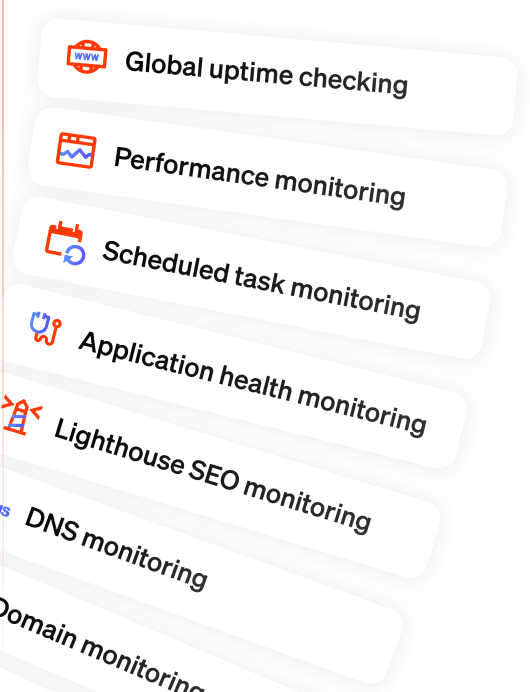
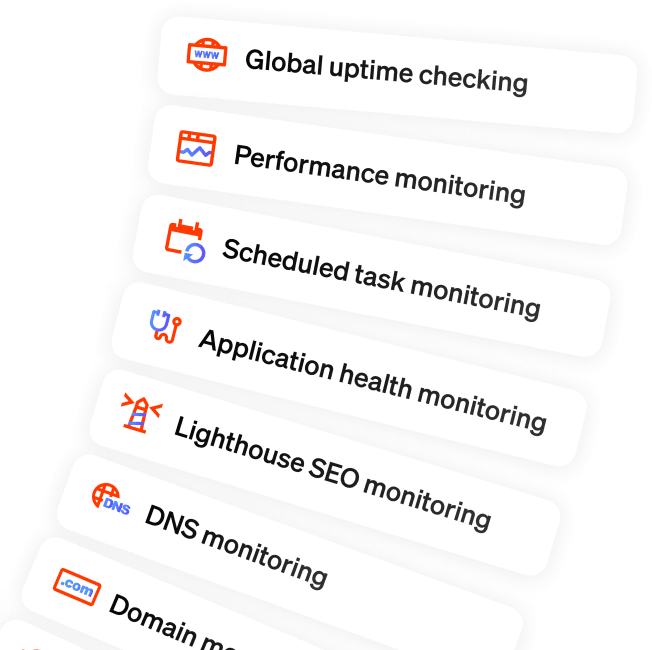
Here's a screenshot from our staging environment, where we run a "Monitor" for each type. Notice that in the main navigation, we don't have "Sites" anymore, but "Monitors".
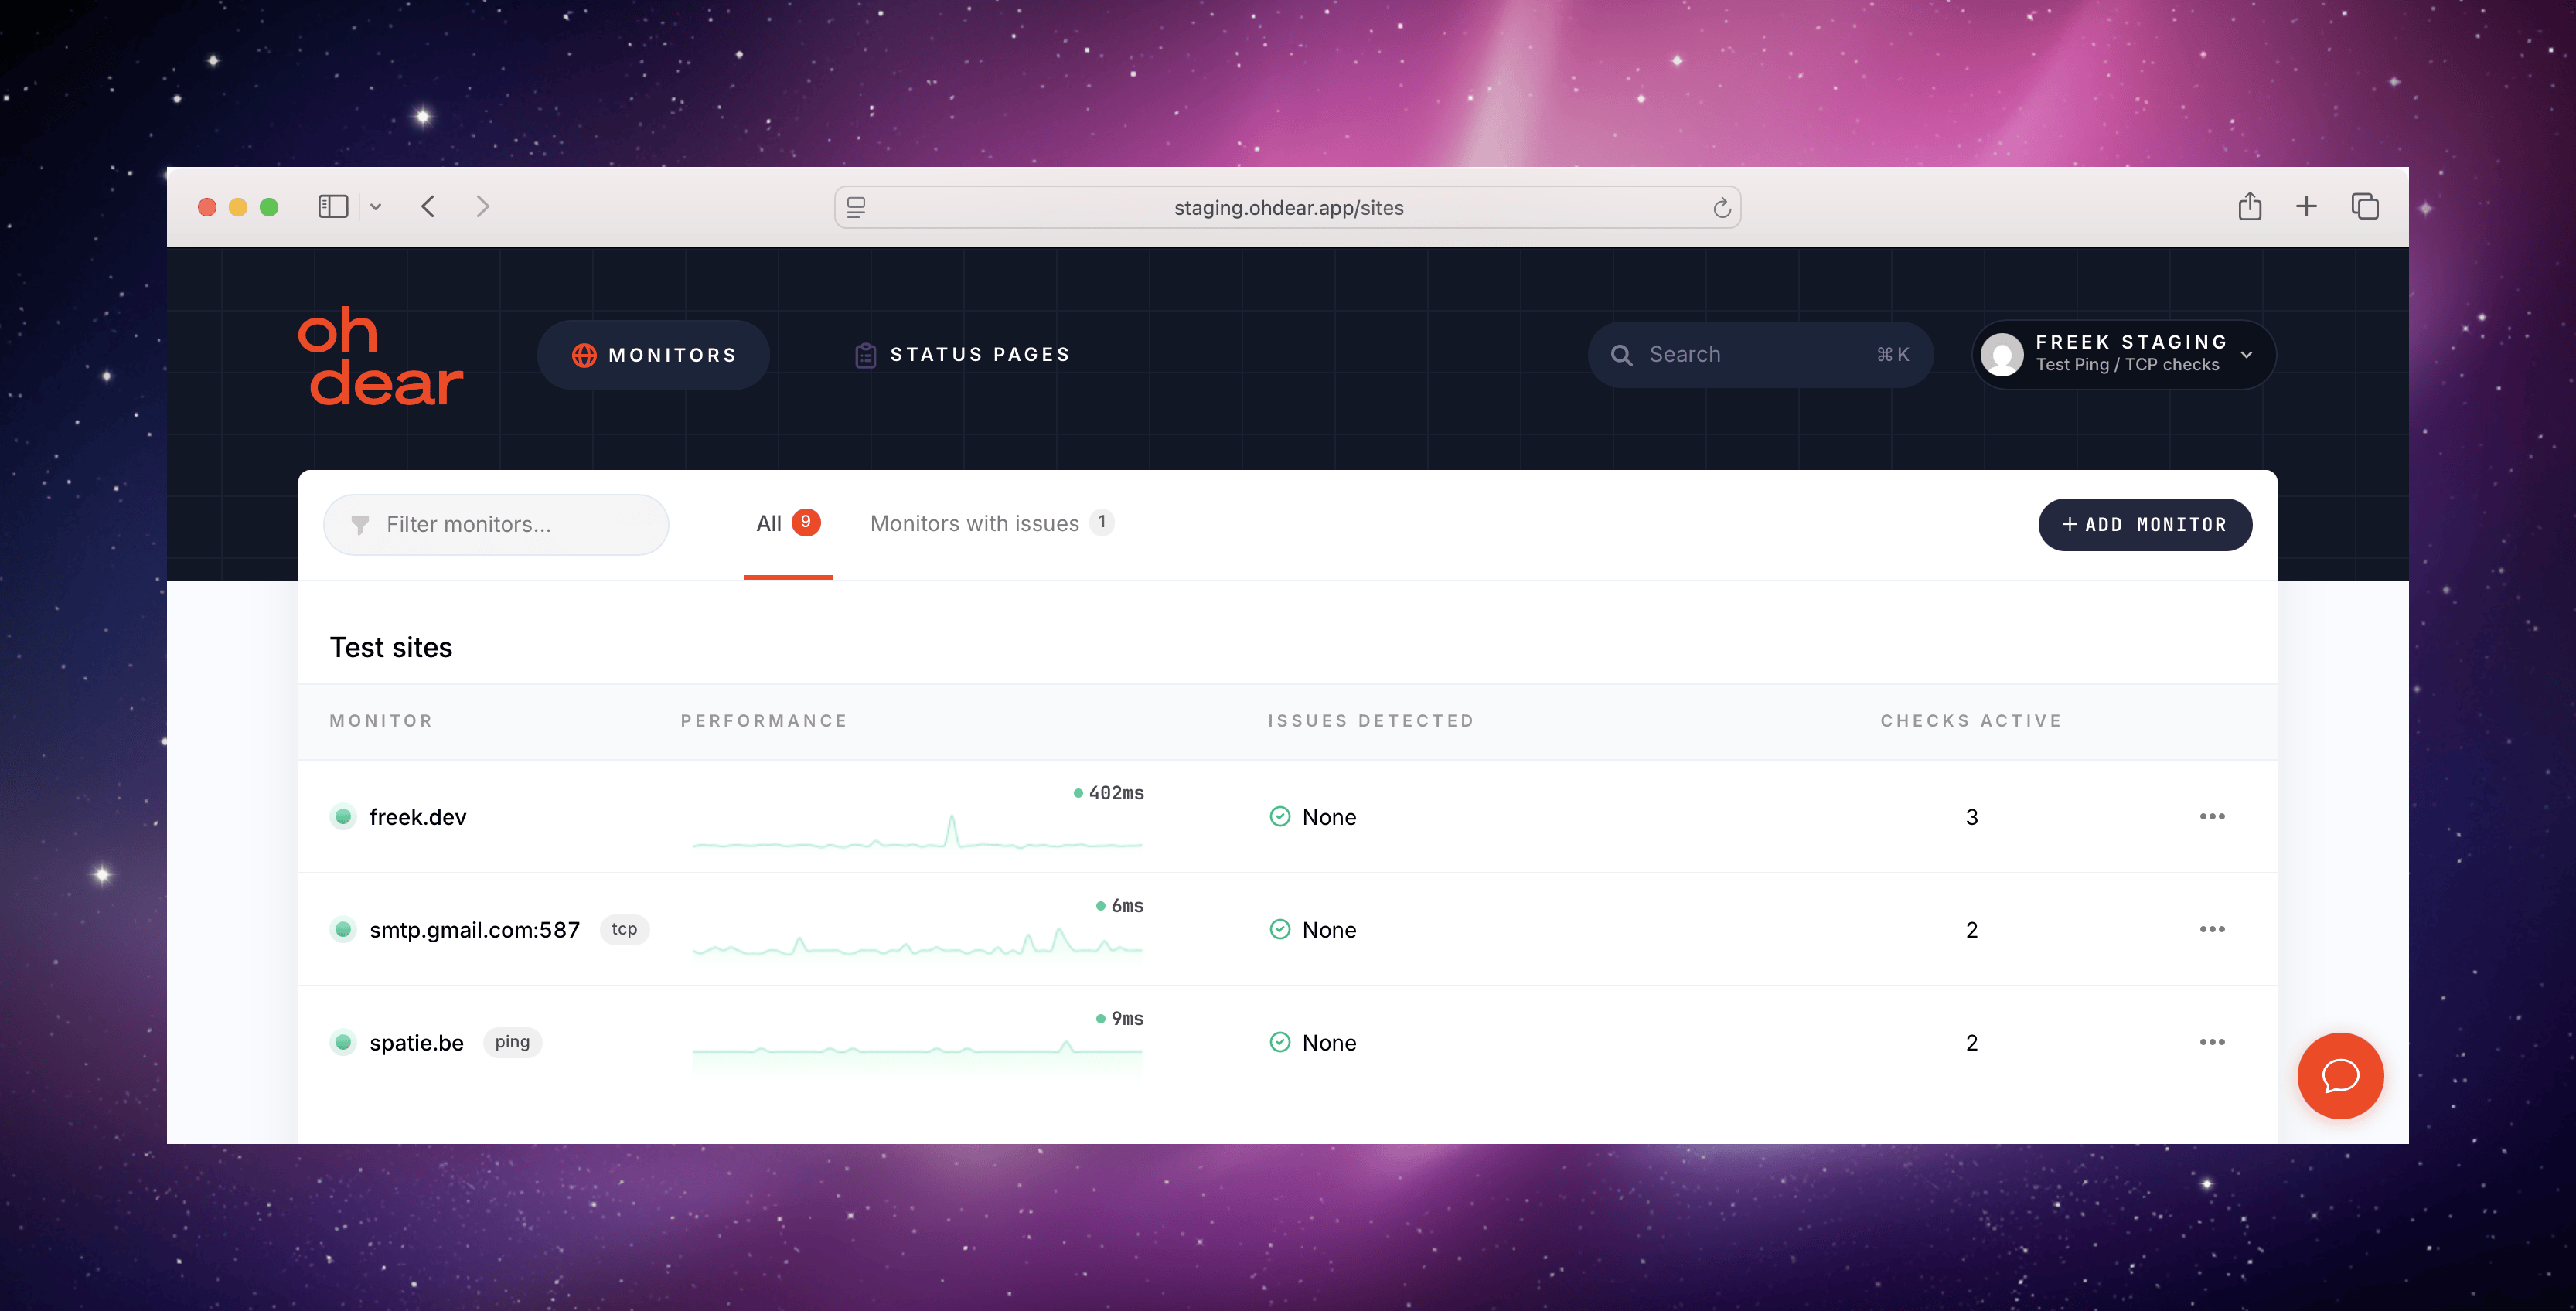
Across our UI, notifications and docs, we'll change the language so we'll talk about "Monitors", instead of "Sites". We're also busy with updating our entire codebase. Internally our Site model is renamed to Monitor, together with all relationships, foreign keys, views, controllers... Together with the technical rename, we'll also pay off other technical debt that was accrued over the years.
This will also affect our API. At Oh Dear, we value backwards compatibility. In the eight years that we've been in operation, we've never made a breaking change to our API. We also considered keeping a v1 of our API, but we decided against it because the maintenance burden would be too big.
We'll help prepare you #
On Tuesday 26st August, we'll be making breaking changes to our API. The "sites" endpoints will be renamed to the "monitors" endpoint. We also rename and regroup some of the attributes.
To help you through these changes, we'll publish a page with instructions on how to update to the new API. We will also update our PHP SDK package and related packages. We'll also send you a dedicated mail with a reminder an upgrade instructions.
To adapt your scripts, see our recipes for automating Oh Dear.
More features are coming #
Ping/TCP isn't the only new feature we have planned. Our uptime check runs once per minute by default. For most people this is fine, but a lot of users have asked for the ability to specify the frequency of checking. So we'll be adding that.
We also have other exciting things on the table, but it's a bit too early to talk about those. Should you have any suggestions on how to improve Oh Dear, do let us know by filling in our survey.
We'll close off this post by highlighting some of the features that were requested through our survey:
- People with a big number of sites in their team reported that the site list screen is slow. We made it faster, and are still optimizing stuff.
- There's a new usage screen that shows your usage against your current plan
- Maintenance periods can now have a name
- We can now send notifications via Google Chat
- The certificate health check has a new "Detected Certificates" tab showing the history of certificates we detected for a site.
- A graph was added to the lighthouse result history
- Our blog layout was simplified.
- We made it more clear across our UI which things are clickable, by adding the cursor-pointer CSS class to those elements
- You can now manage monthly reports with our API
- Alert snoozing now has full history
- A new login method was added: passkeys
- Our broken links check has a new "Troubleshooting" tab, showing you tips to fix broken links.
- We merged our uptime and performance check