Introducing new performance monitoring for your websites
Published on June 9, 2020 by Mattias Geniar

We're excited to announce all Oh Dear users now have access to detailed performance metrics for all of their websites!
Let us take you through a quick tour of the new performance monitoring.
An updated dashboard #
All our users will see a new dashboard upon login. We'll show you a performance graph and the latest response times next to the existing checks of uptime, broken links, mixed content & certificate health.
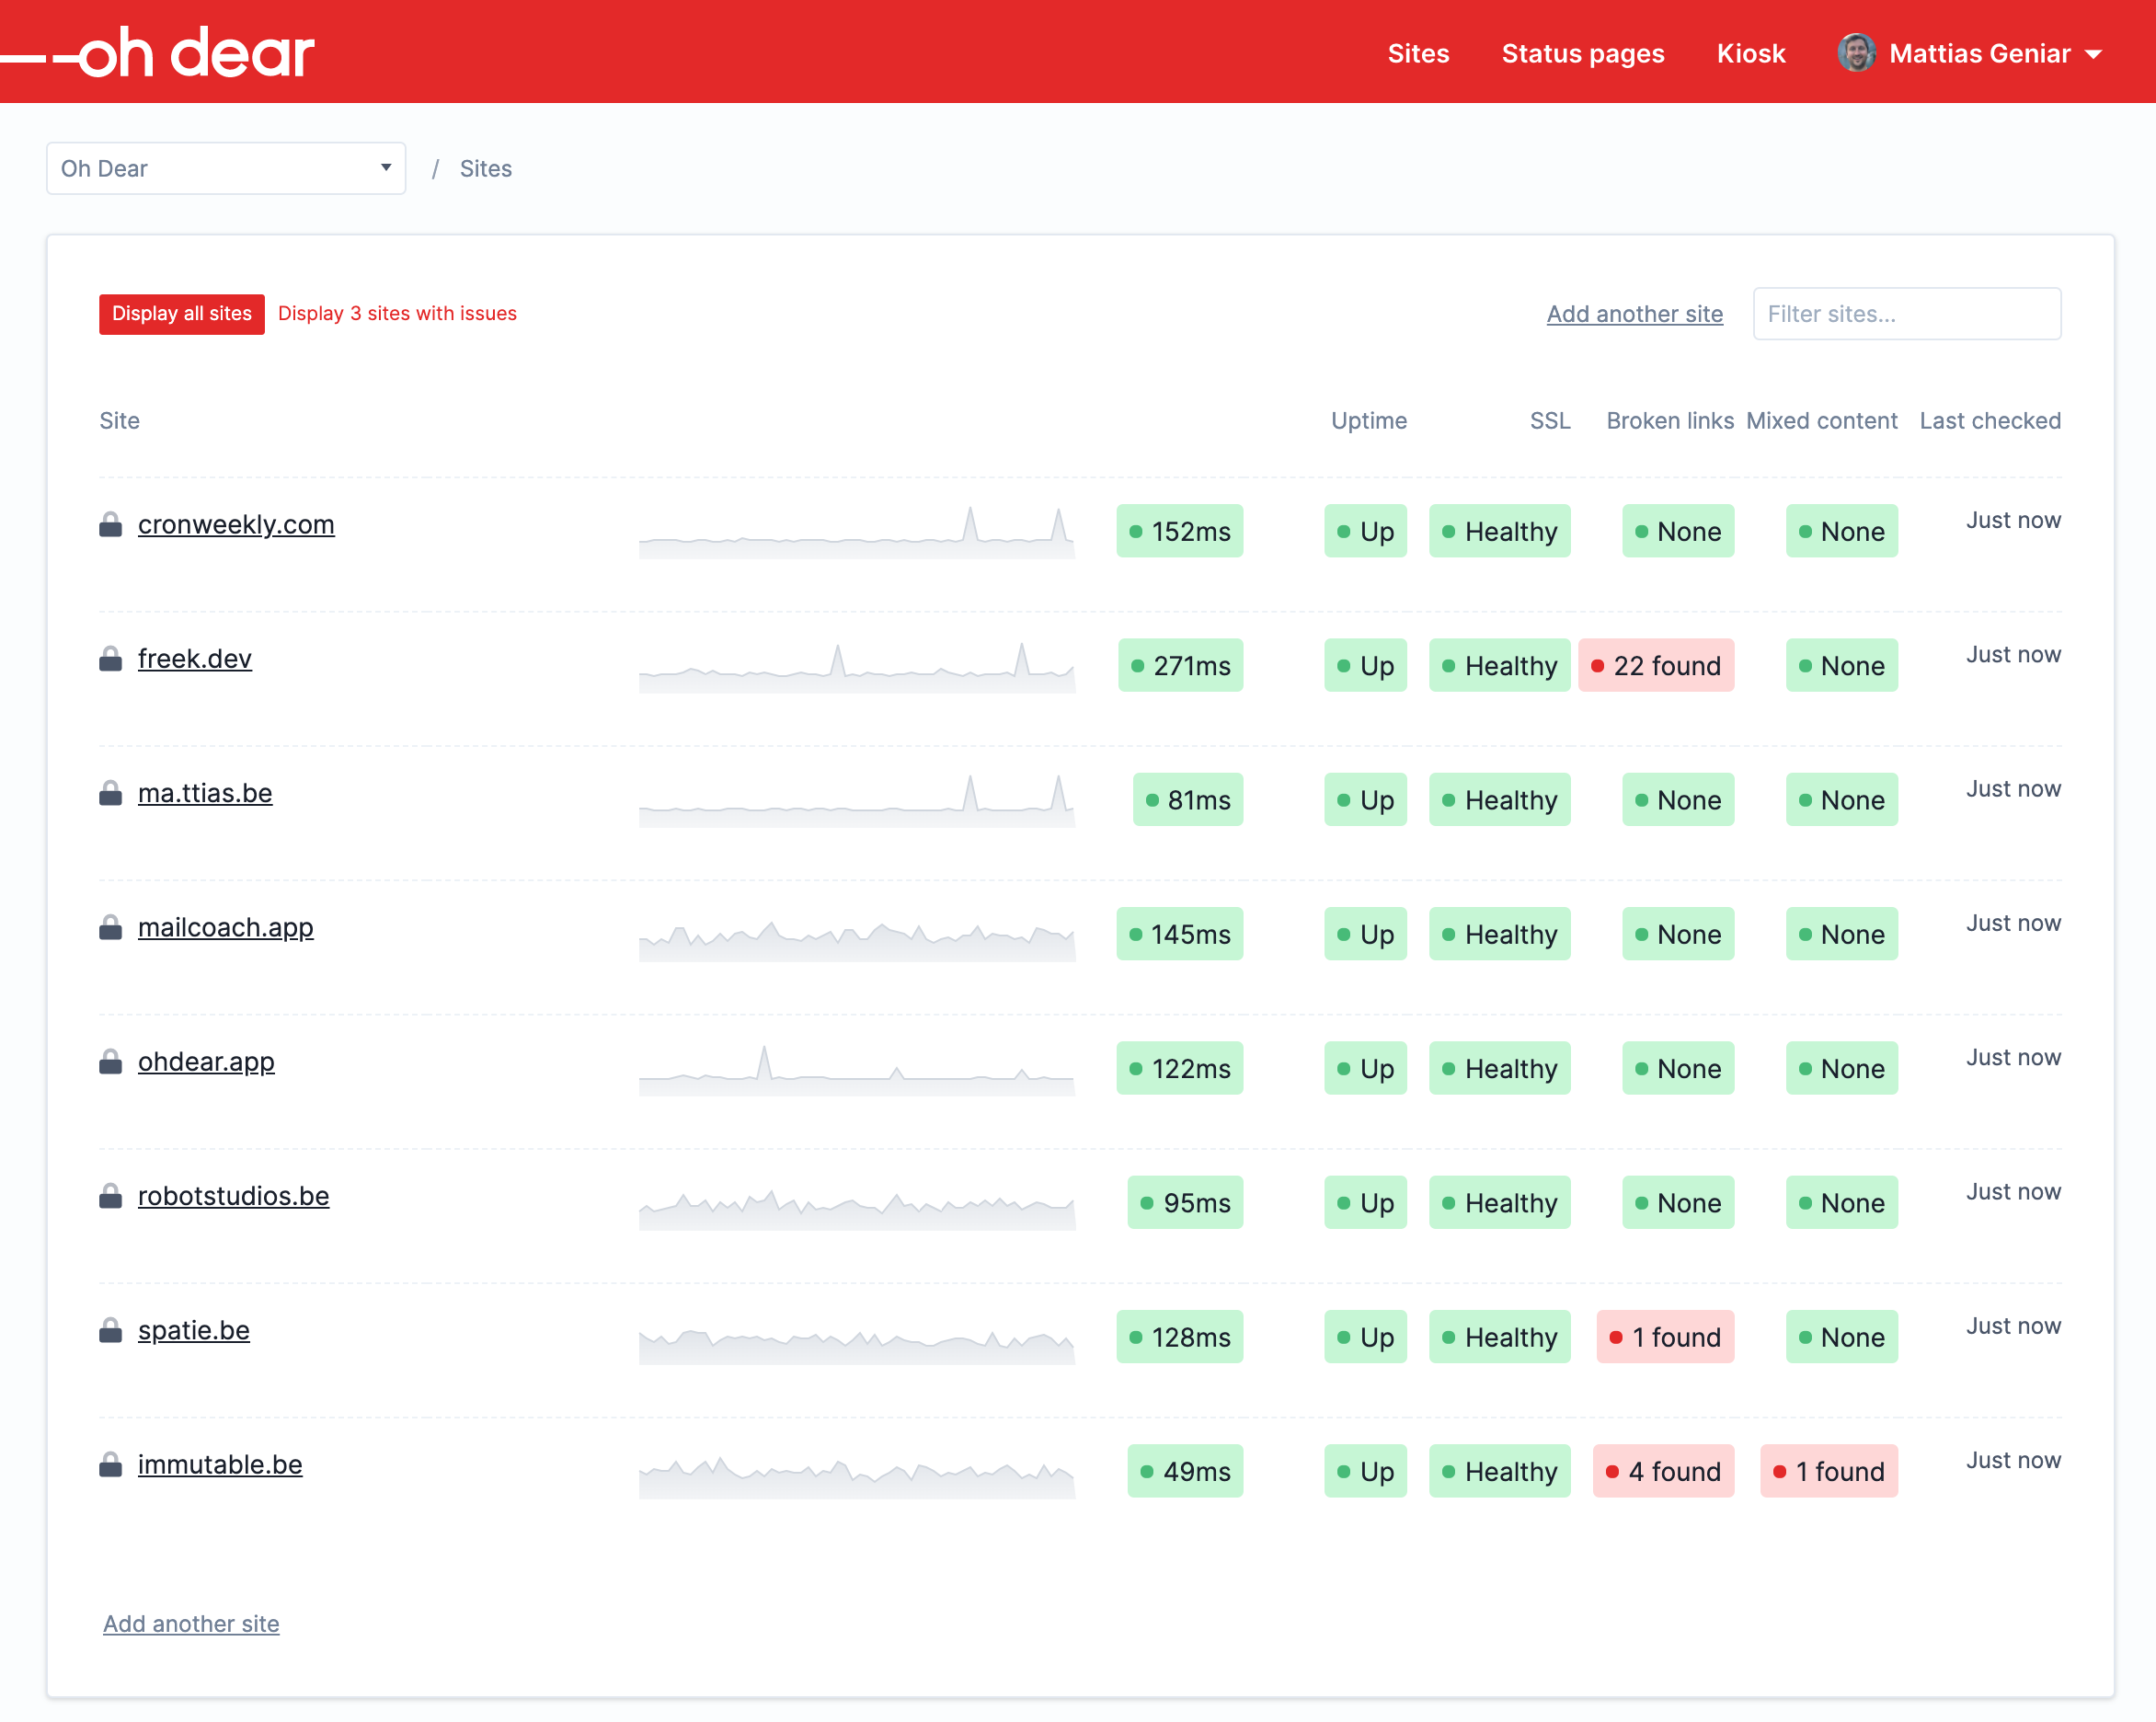
The dashboard updates in real-time, as soon as we have new performance metrics. You'll be able to see the data come in and the graph will auto-update itself!
Detailed performance metrics #
You can click through on the graph on the dashboard or the left-hand menu on the overview page of a site. In there, you'll be able to see detailed metrics of the performance of your website.
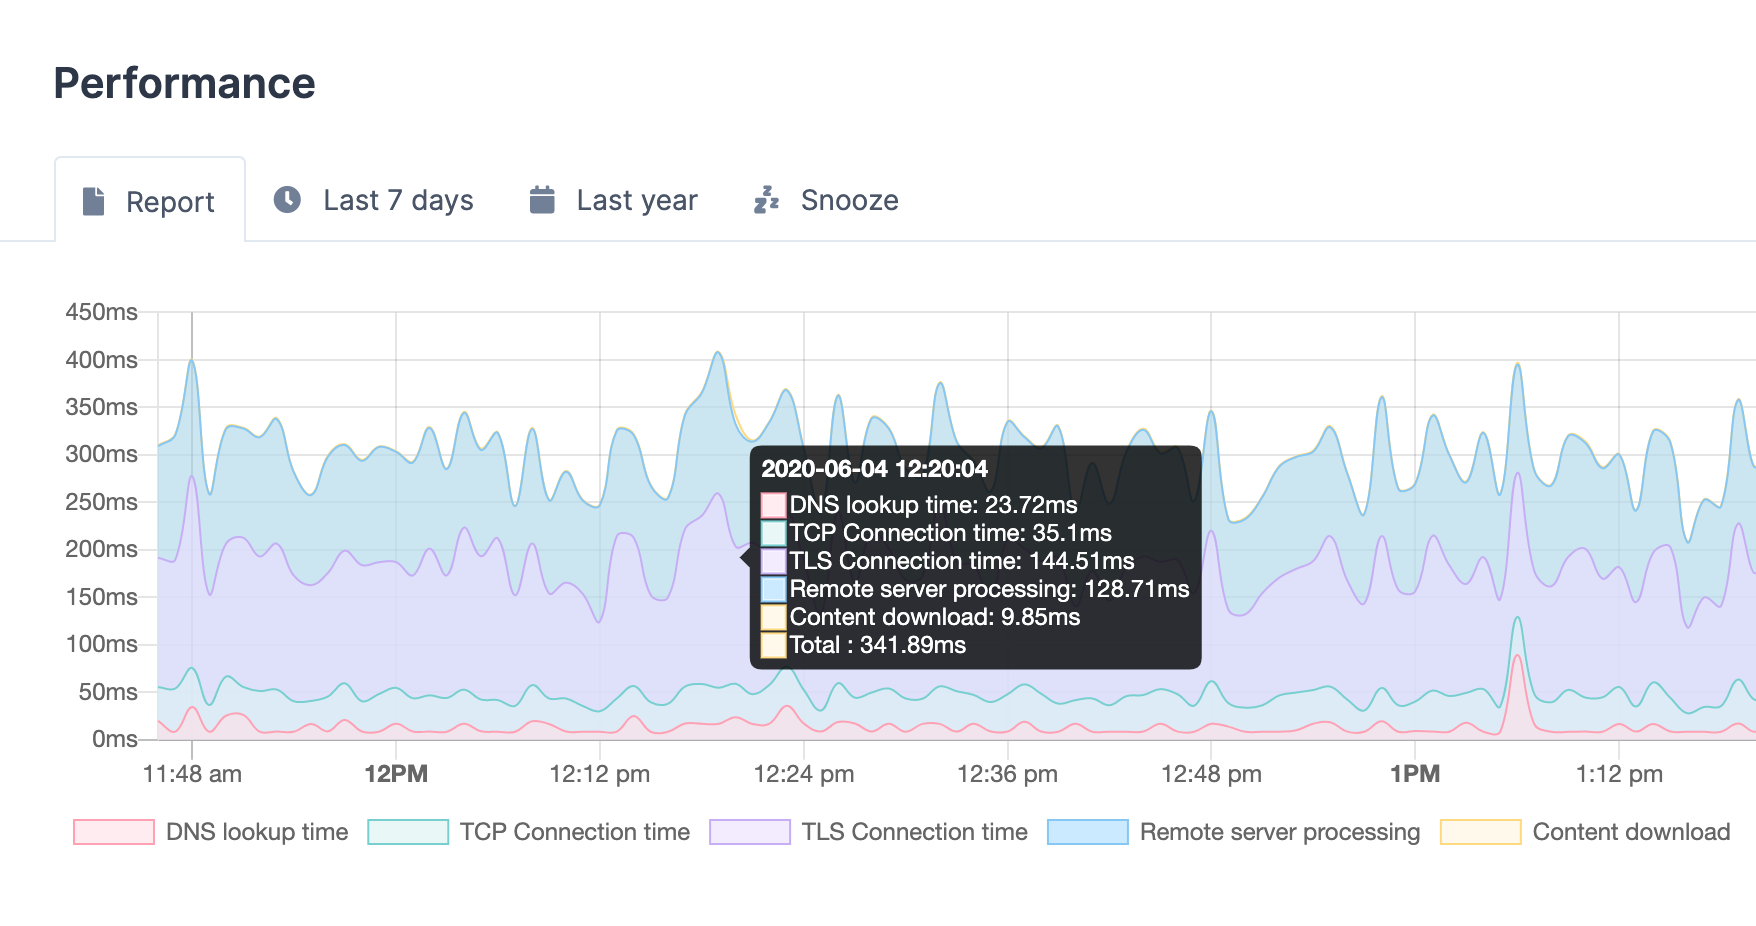
If you hover over the chart, we'll pop-up the breakdown of each area of your performance.
We show you the following data:
- DNS lookup: The time it takes to resolve the domain name to an IP address via DNS.
- TCP Connection Time: The time it takes to connect to the remote host (TCP three-way handshake).
- TLS Connection Time: The total time it took for the TLS handshake to complete (cipher negotiation & encryption).
- Remote Server Processing: The time it took the server to process the request and start sending the first byte of the page. This is also known as the Time To First Byte or TTFB.
- Content Download: The time, in seconds, it took for the page to be downloaded from the remote server.
Each of those metrics will allow you to pinpoint particular problems related to your website performance.
Get notified on performance issues #
The feature was designed with two clear goals in mind:
- You want to define a hard threshold in terms of performance goals
- You want to know when your performance characteristics suddenly change
You're now able to define a threshold for what you consider to be slow. Our default is 3500ms, or 3.5 seconds.
Once a site consistently crosses the 3.5 second mark, we'll notify you that things are getting a bit slow. We hope our users will crank that up so the threshold is a lot lower than 3.5 seconds. 😁
Our other alert relates to a change in performance: imagine you deploy your site, but it gets about 50% slower. Or faster? Classic monitoring will report the site as up and your visitors can still see it, but it has drastically changed the speed of the site.
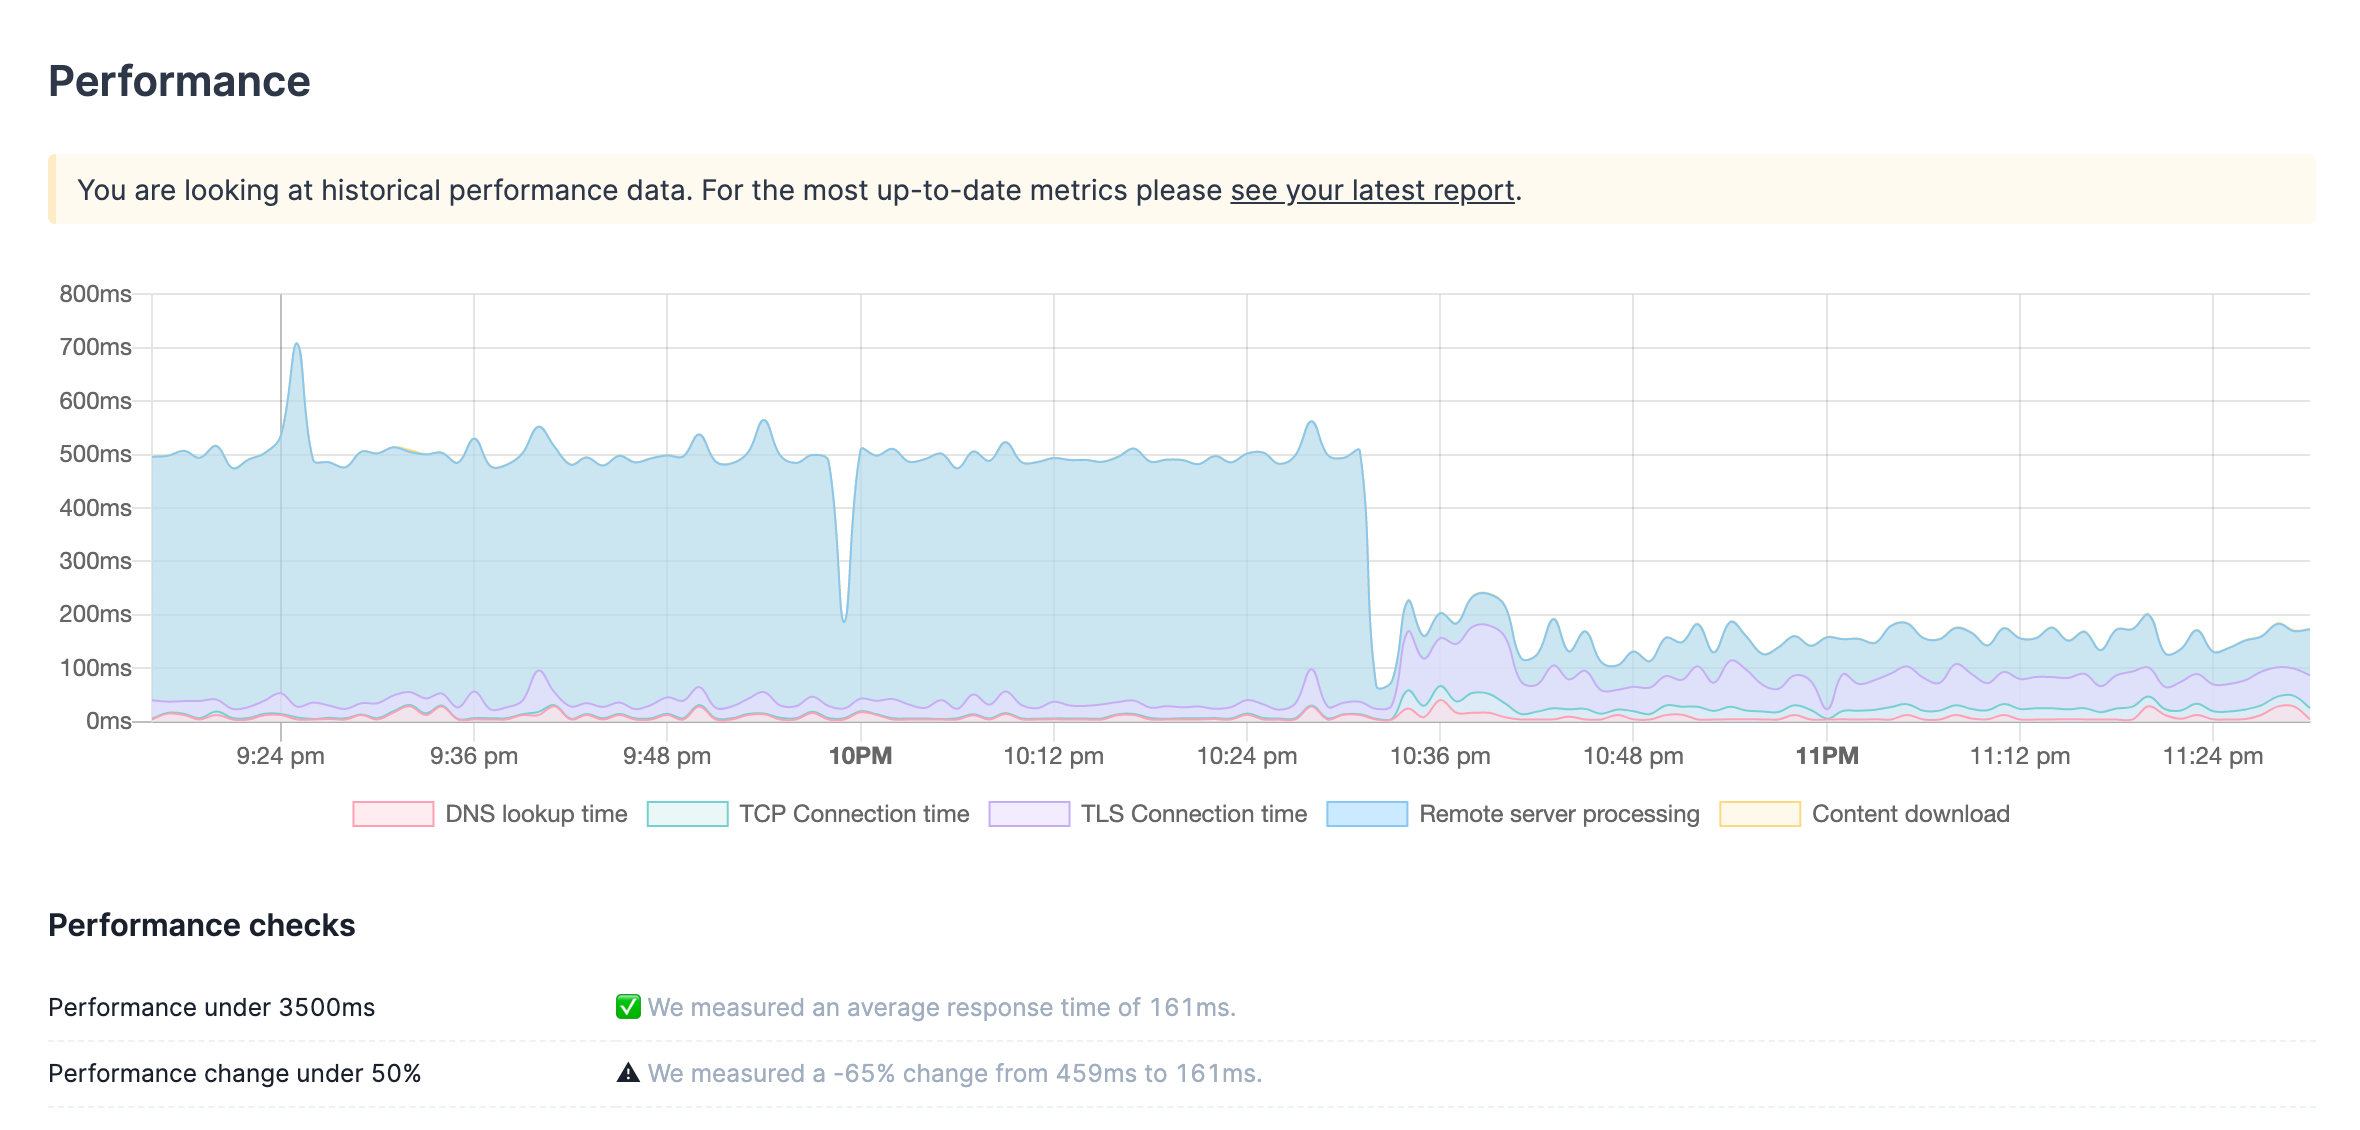
Our default alert is a sudden change of 50% in performance: if we detect your site is slowing down or getting a lot faster, we'll make sure you know!
It may be harmless, it may even be good news, but we reckon you'd like to know whenever there's a big change like this.
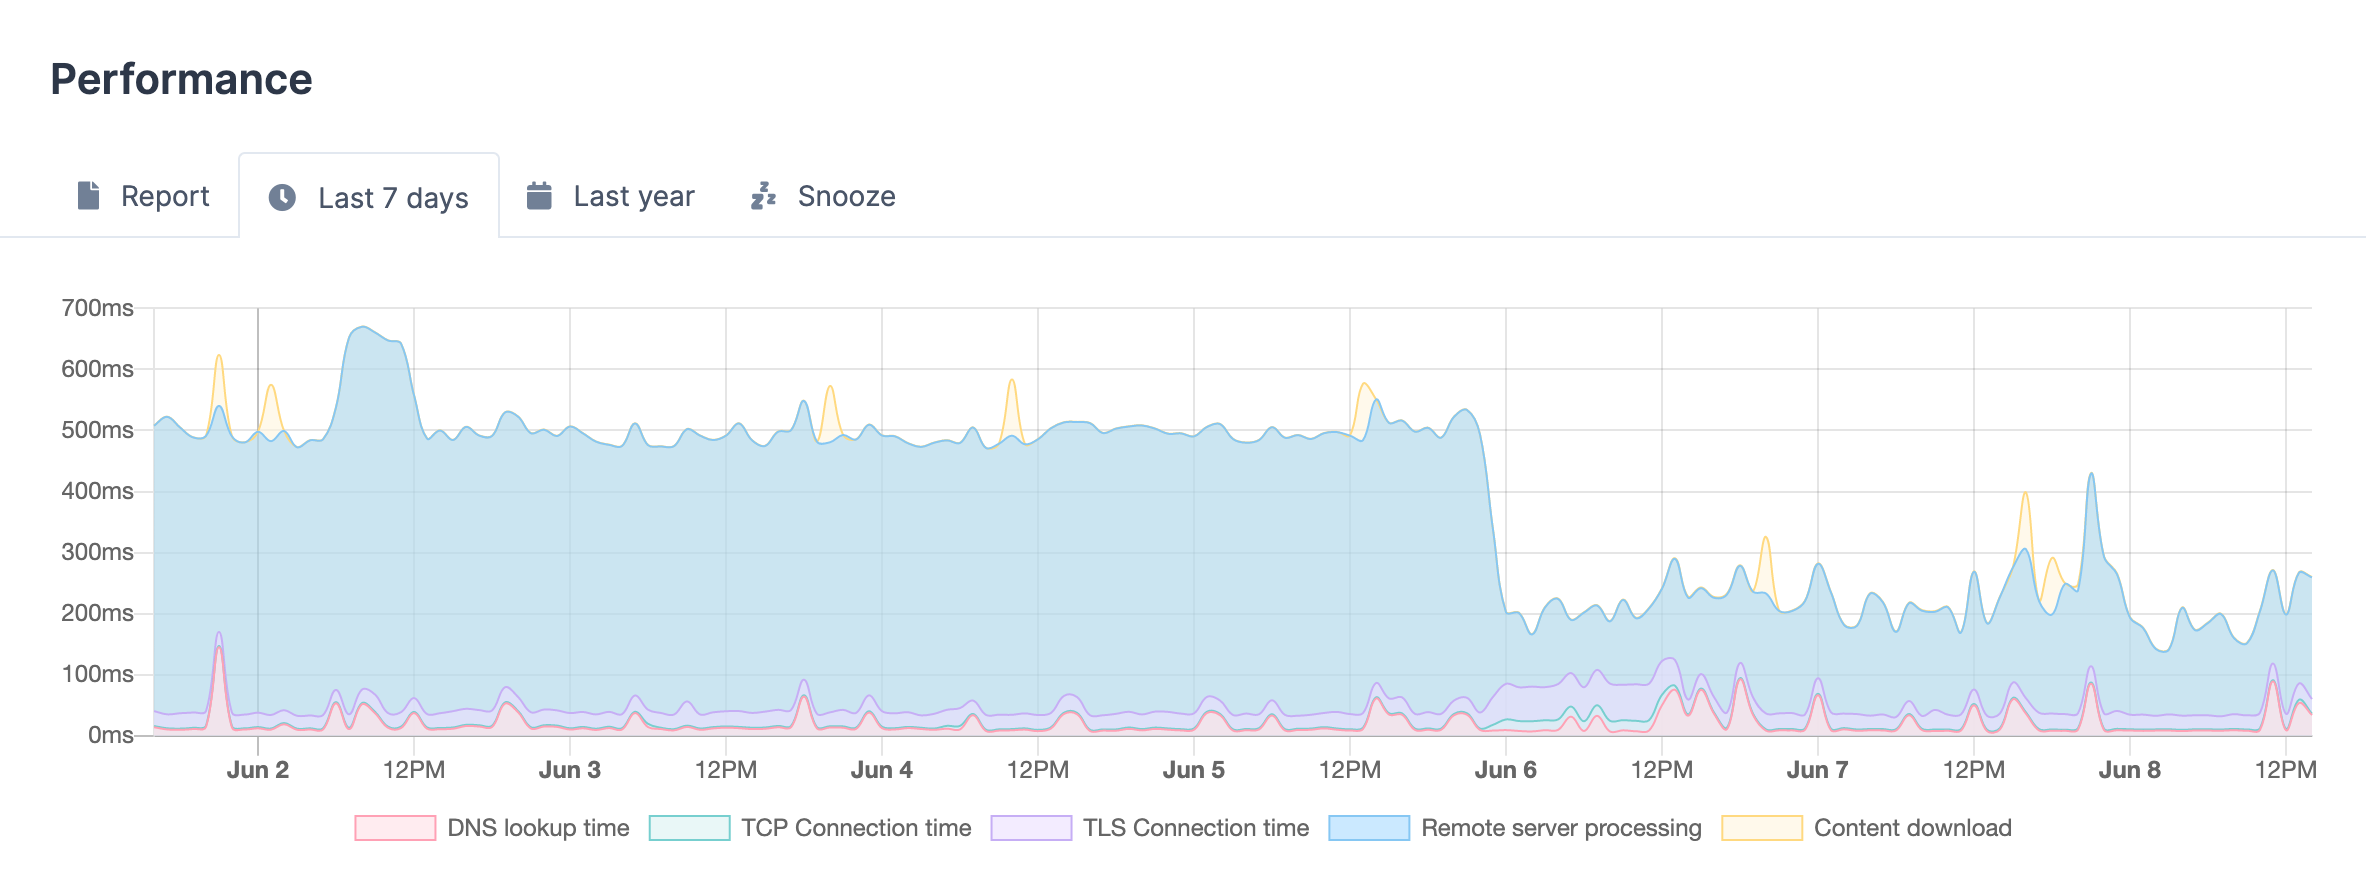
History data & trending #
You're able to see the most granular data for the last 14 days. We'll aggregate the data in hourly averages for long-term storage and trending.
Per site, you can see a quick view for the last 7 days, and a view with all historic datapoints.
In one of our next releases, we'll add the ability to export this data as a PNG or PDF so you can use it in your client reports.
Data available through our API & SDK #
We've added the necessary endpoints to our API to allow you to retrieve the data at your convenience.
$ curl https://ohdear.app/api/sites/1/performance-records?filter[start]=20200607125435&filter[end]=20200608125435&filter[timeframe]=1m \
    -H "Authorization: Bearer $OHDEAR_TOKEN" \
    -H 'Accept: application/json' \
    -H 'Content-Type: application/json'

{
  "data": [
    {
      "id": 121,
      "site_id": 1,
      "created_at": "2020-06-04 11:18:15",
      "time_namelookup": 0.032941,
      "time_connect": 0.029106,
      "time_appconnect": 0.076993,
      "time_pretransfer": 0.00015999999999999348,
      "time_remoteserver": 0.03007500000000002,
      "time_redirect": 0,
      "time_download": 0.0007059999999999844,
      "time_total": 0.169981
    },
    {
      "id": 122,
      "site_id": 1,
      "created_at": "2020-06-04 11:19:15",
      "time_namelookup": 0.008363,
      "time_connect": 0.020259,
      "time_appconnect": 0.042906999999999994,
      "time_pretransfer": 0.00010600000000000886,
      "time_remoteserver": 0.020762000000000003,
      "time_redirect": 0,
      "time_download": 0.0005309999999999898,
      "time_total": 0.092928
    },
    {
      ...
    }
  ],
}
For more information, please have a read of the performance metric API docs.
If you use our PHP-SDK, a convenient PHP package that acts as a wrapper for our API, you can also query for performance records as of version 2.0.0.
<?php
$sdk->performanceRecords(1, '2020-06-07', '2020-06-08');

$sdk->performanceRecords(1, '2020-06-07 09:00:00', '2020-06-08 17:00:00');
It accepts a site ID, the start and end date, and will return an array of all the detailed performance metrics we have available.
For more details, have a look at the detailed documentation on the new performanceRecords() method.
Want more information? #
Looking for some more reading on the new performance monitoring? Well, we've got you covered!
- More high-level details are available on the performance feature page
- Our documentation has been updated to cover the performance checks
- We have API integrations available
- To help consume the data, we have updated our PHP-SDK
Want to give it a try? #
Want to know how fast your own website is?
Sign up to create an account and you'll see the detailed metrics appear!