
 laravel.com
 ign.com
 takeaway.com
Stop wondering if your site is up
Without monitoring, you're constantly wondering: Is the site up? Did that deploy break anything? Are customers experiencing issues right now? You check manually, refresh the homepage, maybe ask colleagues if they're seeing problems.
Most downtime happens from predictable causes: human error during deploys, DNS configuration mistakes, server overload, domain expiration, or network connectivity issues. These happen to every team eventually.
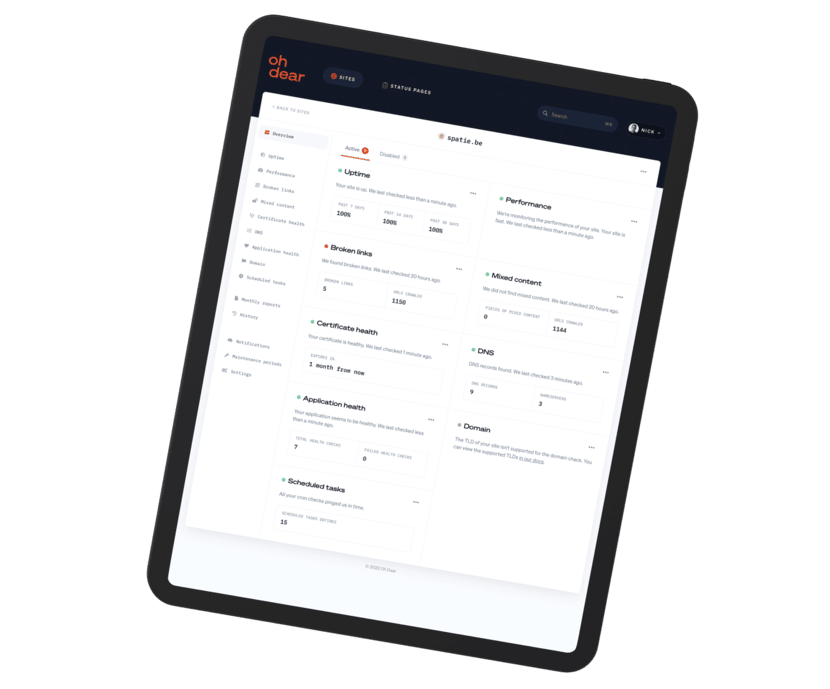
Our monitoring runs every minute, checking all your sites from multiple global locations. Your dashboard shows you at a glance that everything's healthy - or immediately alerts you if something's wrong. No more wondering, no more manual checks, no more discovering issues from customer complaints.
Fix issues before anyone notices
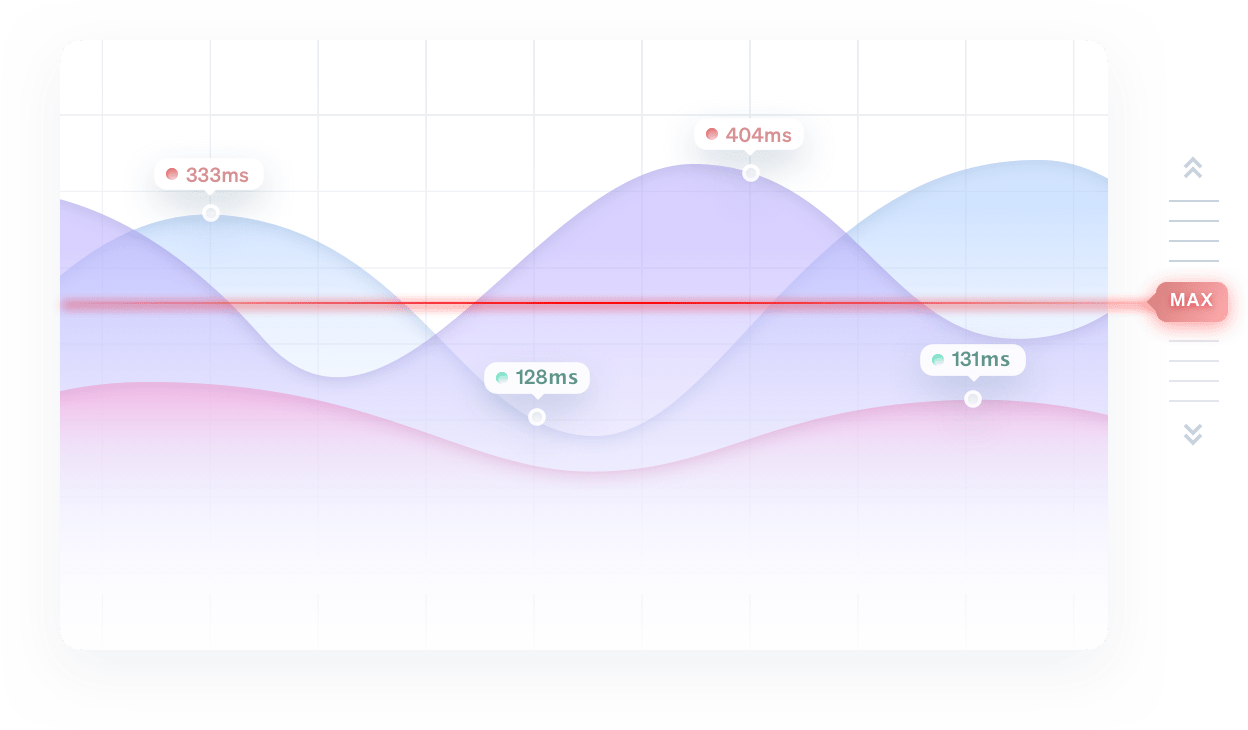
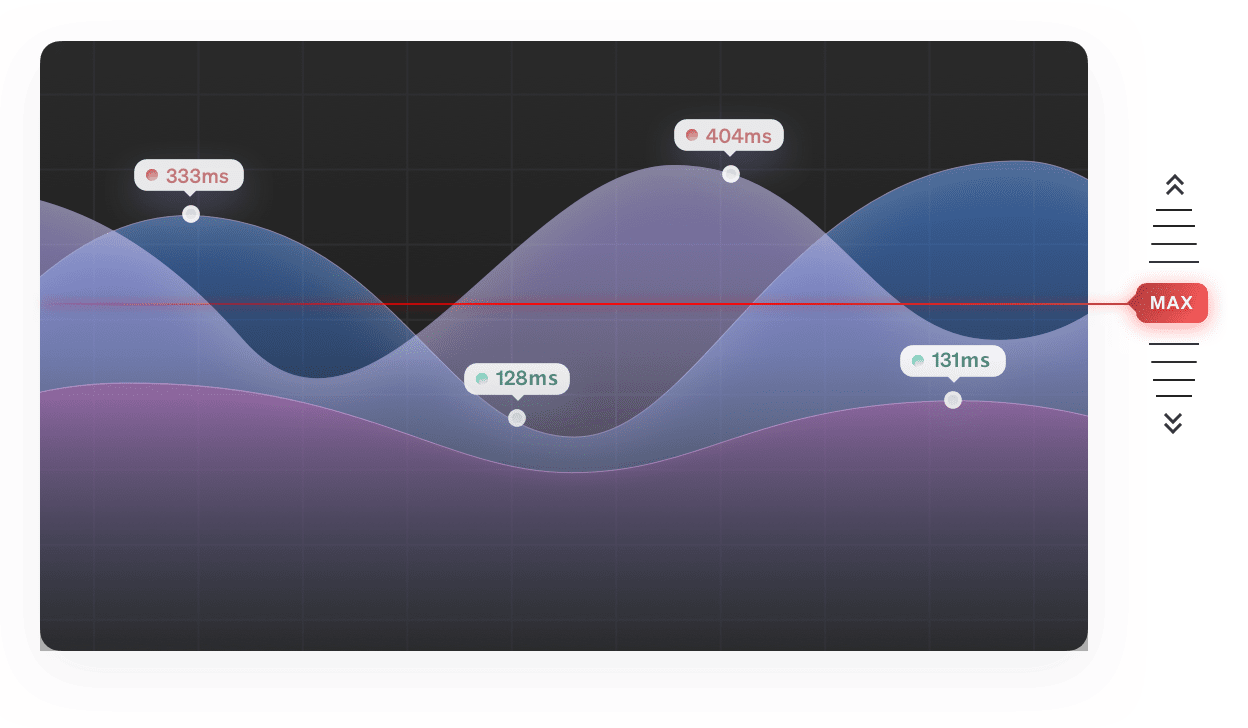
Sites rarely go from healthy to completely down in an instant. Performance degrades first: response times spike from 200ms to 2 seconds, then 5 seconds, then timeouts, then full outages.
These early warning signs reveal the real problem: database connections maxing out, memory leaks building up, disk space filling, or external API slowdowns cascading through your system.
Set performance thresholds (like "alert if response time exceeds 3 seconds") to catch degradation before it becomes downtime. You'll have time to investigate, add capacity, or roll back a problematic deploy - before customers start complaining.
This is the difference between fixing an issue during business hours versus getting woken up at 3am by a complete outage. Early warnings let you fix problems on your terms.
Stop discovering downtime from angry customers
Most teams track uptime one of these ways: manually checking after deploys, hoping customers will report issues, checking server logs occasionally, or setting up basic ping scripts that don't catch real problems.
The problem? You discover outages too late. By the time a customer complains or you notice something's wrong, you've already lost revenue, breached SLAs, and damaged trust. Manual checks only happen when someone remembers.
Our monitoring runs every minute from multiple global locations, checking not just if your server responds, but if your site actually works. We verify status codes, response times, and content - catching issues that simple ping checks miss.
You'll know about problems within seconds, often before any customer is affected. Fix issues proactively instead of reactively scrambling after complaints roll in.
Monitoring an API, webhook or scheduled job? See our dedicated API & endpoint monitoring page.
The uptime check covers HTTP(S). For servers that aren't websites, ping monitoring verifies reachability at the network level.
| Component | Value |
|---|---|
| Url | https://urlxyz.com |
| Error description | Operation timed out after 5001 milliseconds with 0 bytes received |
Downtime verified from Paris, France and Bangalore, India
Downtime verified from Paris, France and Bangalore, India
urlxyz.com has recovered after 2m. full report: https://ohdear.app/monitors/83/checks/411
urlxyz.com seems down! Error: HTTP/500 Downtown verified from Paris, France and Frankfurt
Pushover has been successfully enabled. We'll notify you when something goes wrong.
 ntfy
ntfy
urlxyz.com has recovered after 2m. full report: https://ohdear.app/monitors/83/checks/411
ntfy
urlxyz.com seems down! Error: HTTP/500 Downtime verified from Paris, France and Frankfurt
ntfy
ntfy has been successfully enabled. We'll notify you when something goes wrong.
urlxyz.com has recovered after 2m. full report: https:/ohdear.app/monitors/83/checks/411
urlxyz.com has recovered after 2m. full report: https:/ohdear.app/monitors/83/checks/411
Text messages for urlxyz.com have been successfully enabled. We'll notify you when something goes wrong.
$_TOKEN="your API token"
$ curl -X GET "https://notifyservicexyz.com/api/alert/urlxyzcom" \
-H "Authorization: Bearer $_TOKEN" \
-H "Accept: application/json" \
-H "Content-Type: application/json"
urlxyz.com has recovered after 2m. full report: https://app.opsgenie.com/monitors/83/checks/411
urlxyz.com seems down! Error: HTTP/500 Downtown verified from Paris, France and Frankfurt
Opsgenie has been successfully enabled. We'll notify you when something goes wrong.
urlxyz.com has recovered after 2m. full report: https://pagerduty.com/monitors/83/checks/411
urlxyz.com seems down! Error: HTTP/500 Downtown verified from Paris, France and Frankfurt
PagerDuty has been successfully enabled within Oh Dear. Notifications are enabled.
Receive smart and instant alerts
Receive our notifications on your preferred platform. Via email, SMS, Slack, Discord, Opsgenie, PagerDuty, Microsoft Teams, Pushover, ntfy, webhooks,… we can notify you wherever your team is active.
Take notifications to the next level: only notify who needs notifying by assigning responsibilities to different team members.
Oh Dear uses the full potential of each platform's integrations so that notifications become smart and actionable: e.g. you can rerun the uptime check or acknowledge followup alerts without ever leaving Slack!
Reduce support load during outages
When your site goes down, customers immediately start asking questions: Is it just me? Are you aware? When will it be fixed? Without a status page, your support team drowns in tickets, emails, and social media complaints all asking the same thing.
A public status page gives customers a single source of truth. They can check status instantly instead of contacting support. You can post updates once and everyone sees them - no more replying to dozens of individual tickets.
We host your status page separately from your infrastructure, so it stays online even when your site is down. Customize the design to match your brand, set it to auto-update based on monitoring results, or manually control what customers see. Your choice.
During outages, a status page transforms chaos into calm. Customers know you're aware and working on it. Support can focus on fixing the issue instead of answering repetitive questions.
Monitor everything without installing anything
Most monitoring solutions require installing agents on every server, consuming CPU and memory, opening security concerns, and creating maintenance overhead. Agent-based monitoring adds complexity: software to update, credentials to manage, potential conflicts with your stack.
Our uptime monitoring is completely external. We check your sites from our servers - nothing to install, nothing running on your infrastructure, no performance impact. Just add your URL and you're monitoring within seconds.
This means you can monitor everything: production servers, staging environments, client sites, third-party APIs, services you don't control, or infrastructure where you can't install agents. As long as it has a URL, we can monitor it.
Simple, lightweight, and universal. No agents to maintain, no server resources consumed, no security surface area expanded.
Get complete diagnostic data for every failure
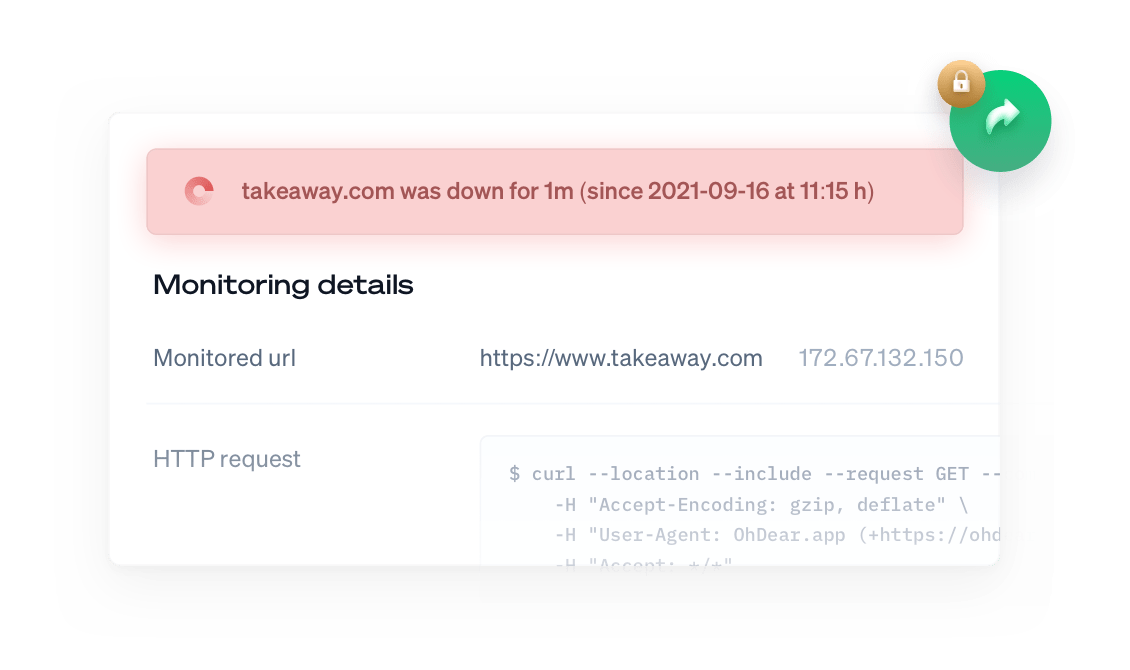
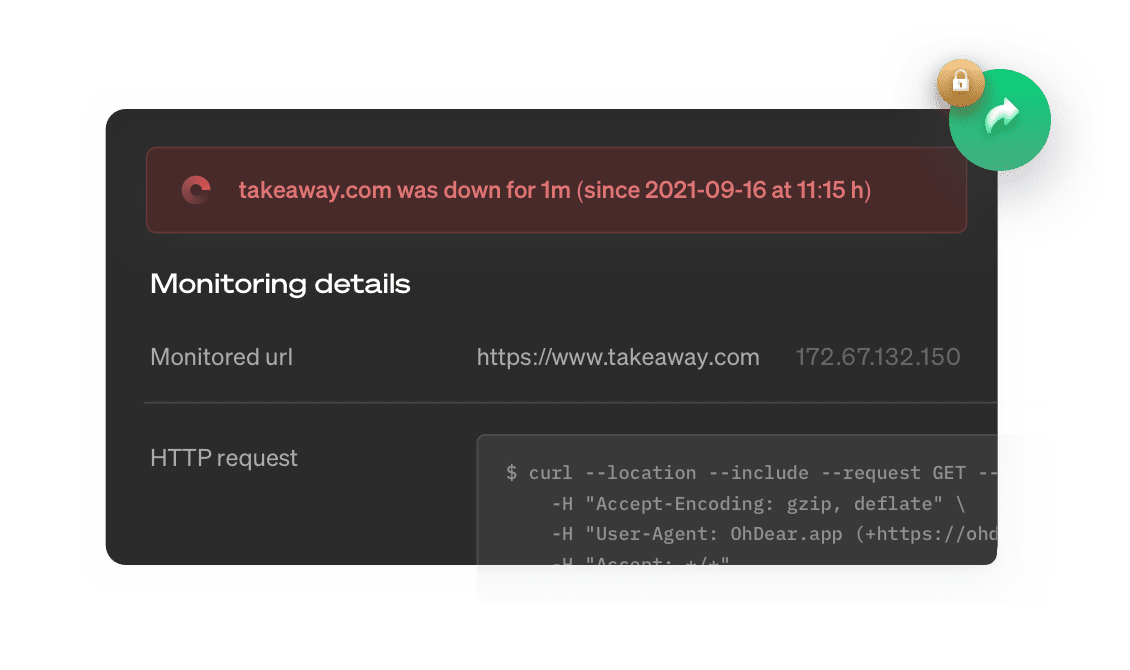
When something breaks, vague alerts waste time. "Your site is down" doesn't help engineers fix the problem. You need details: what failed, how it failed, and how to reproduce it.
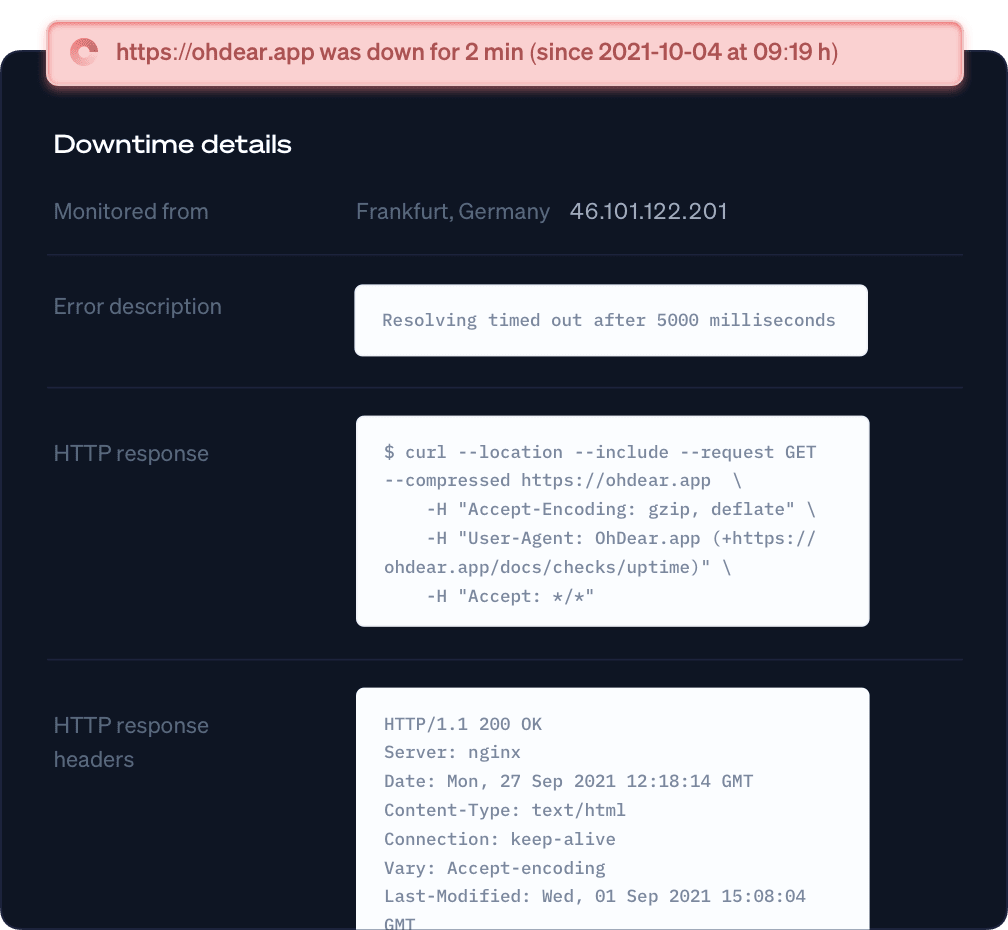
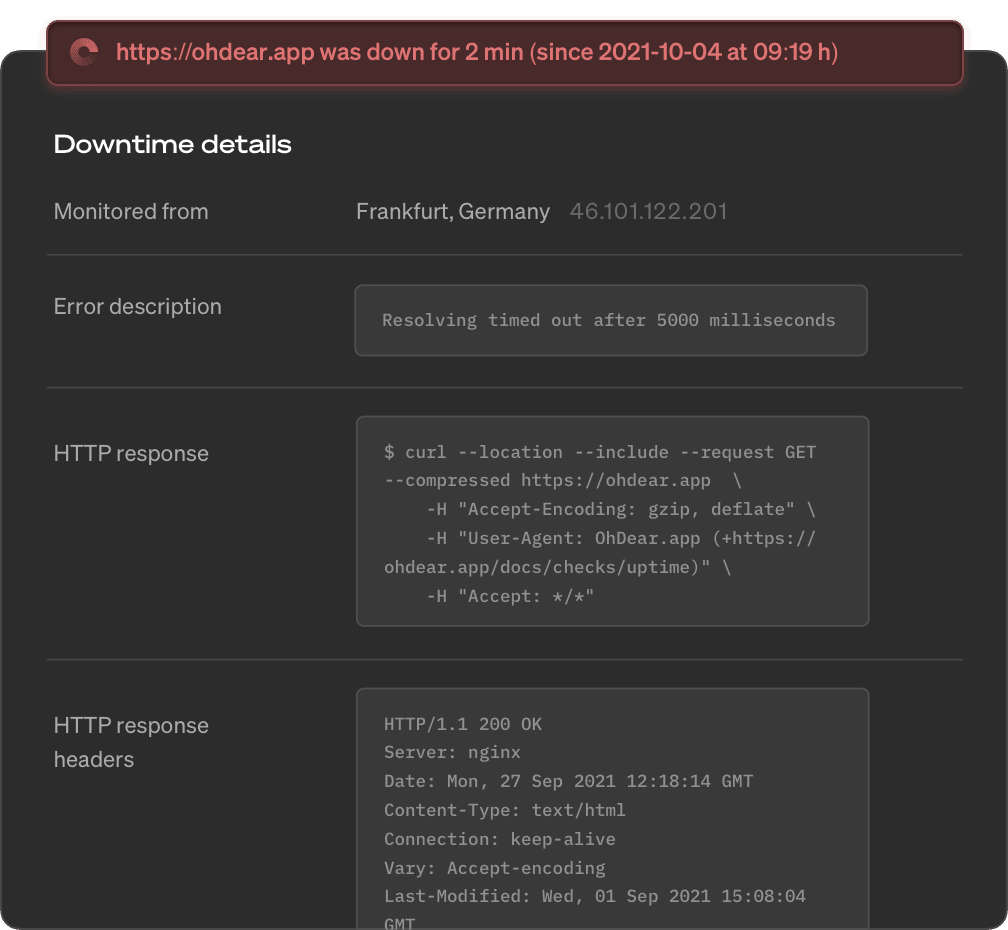
Every downtime alert includes complete diagnostic data: the full HTTP response body, all HTTP headers (request and response), exact status codes, and a ready-to-run curl command that replicates our exact request. Copy, paste, and see exactly what we see.
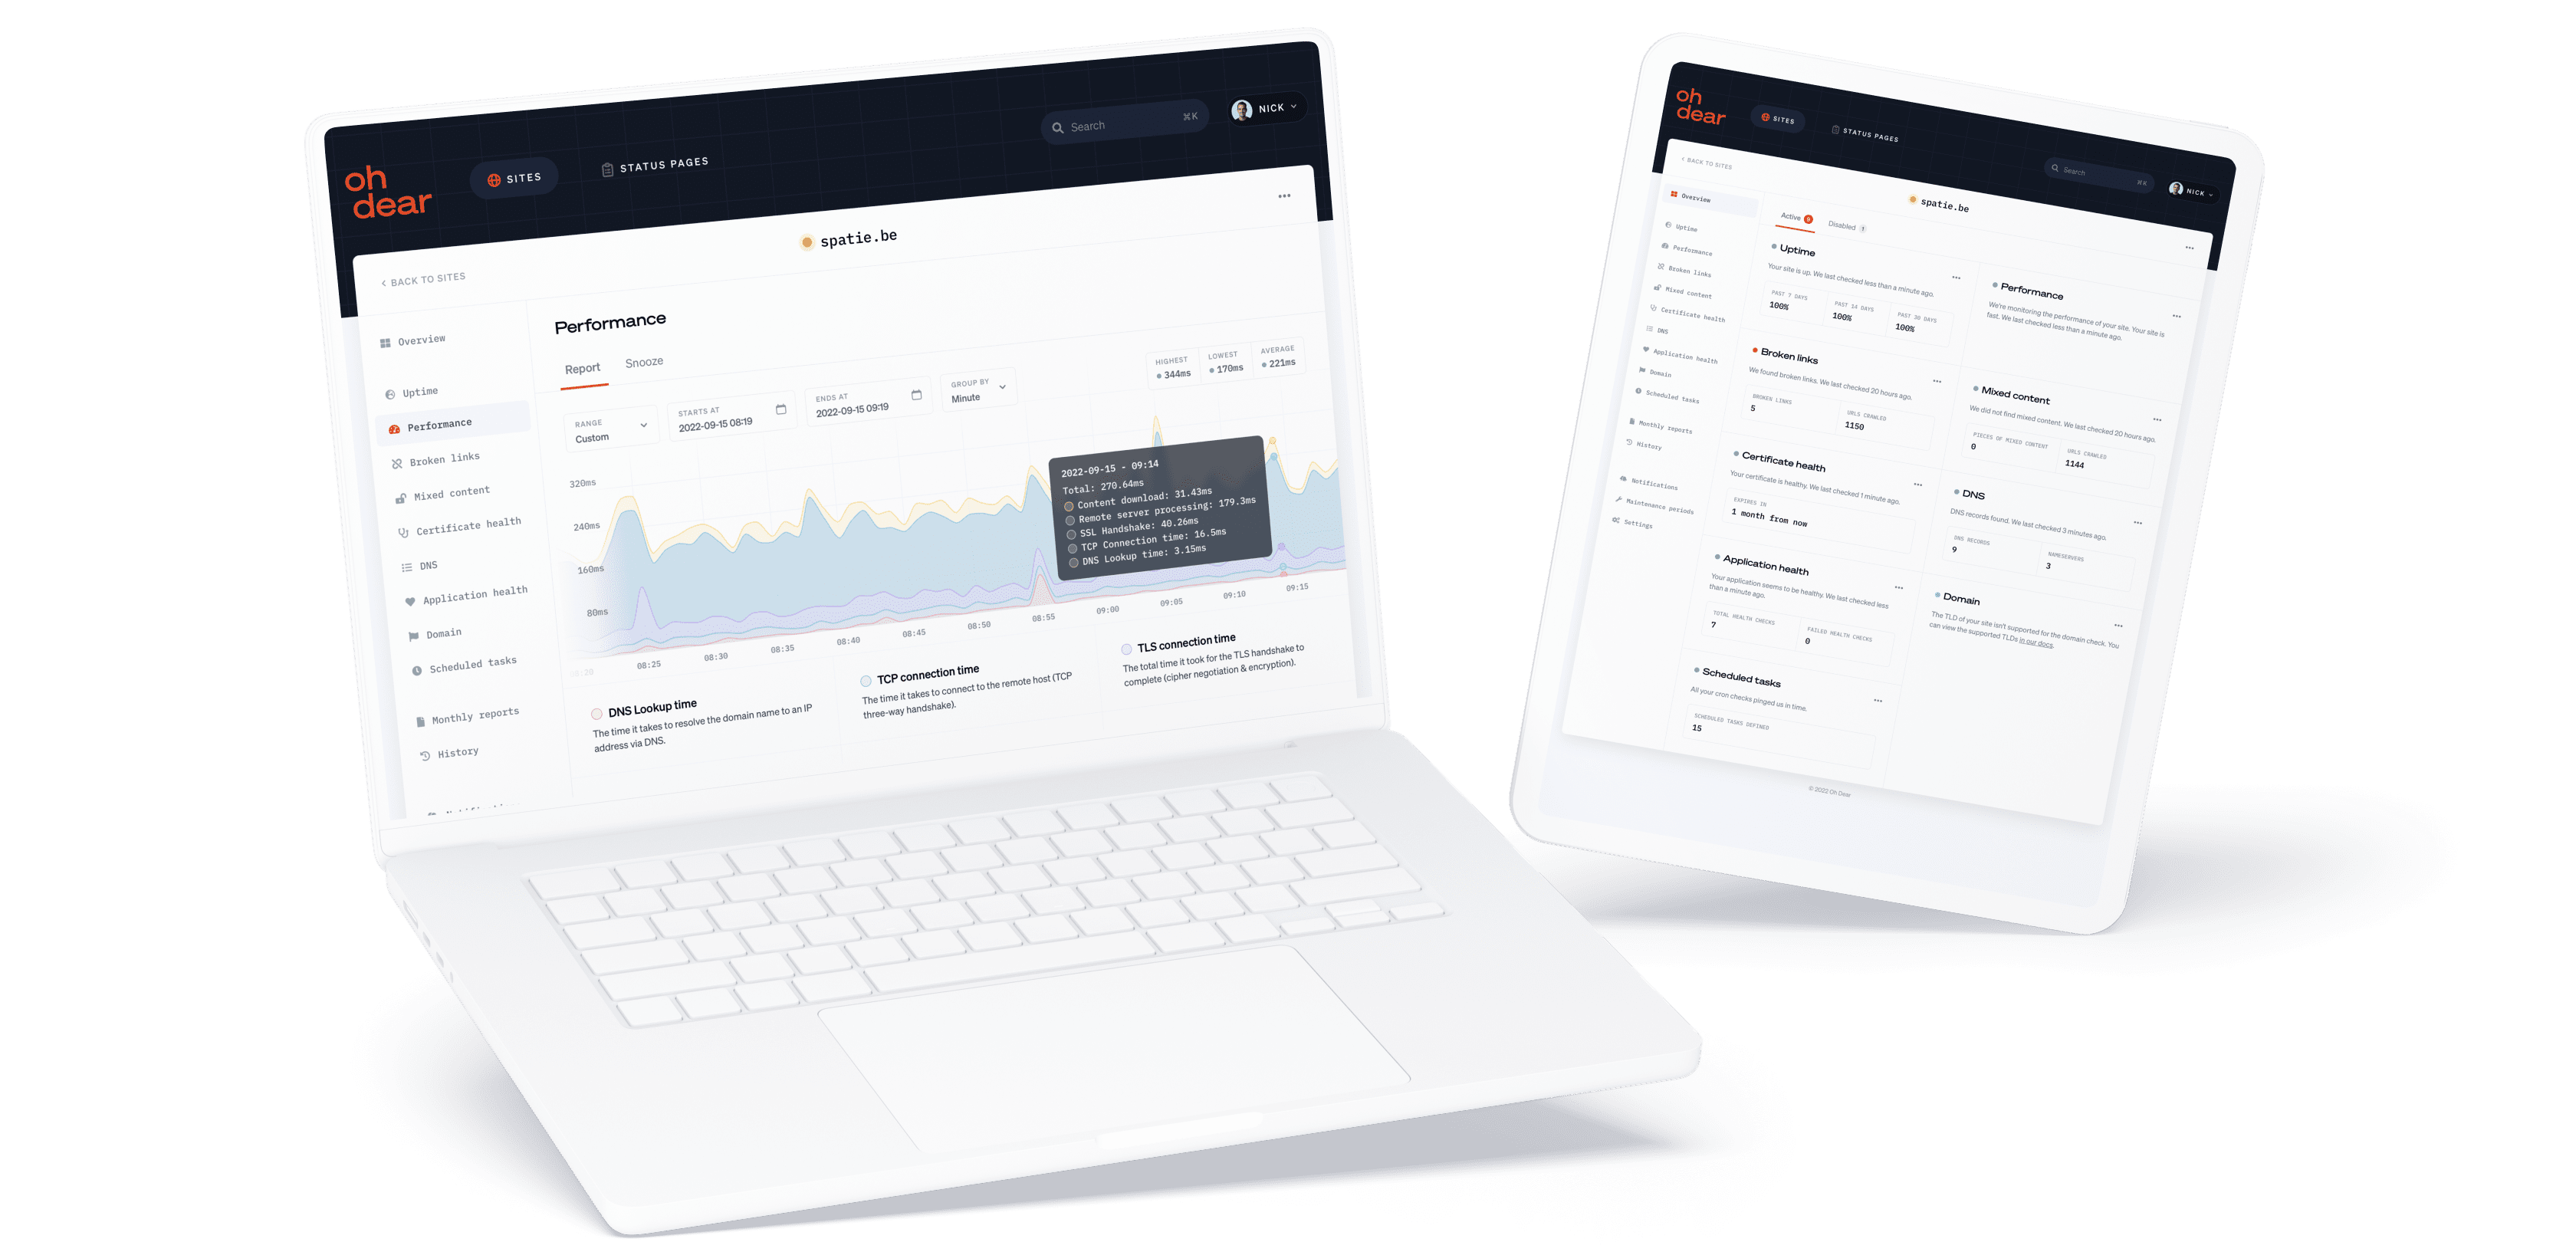
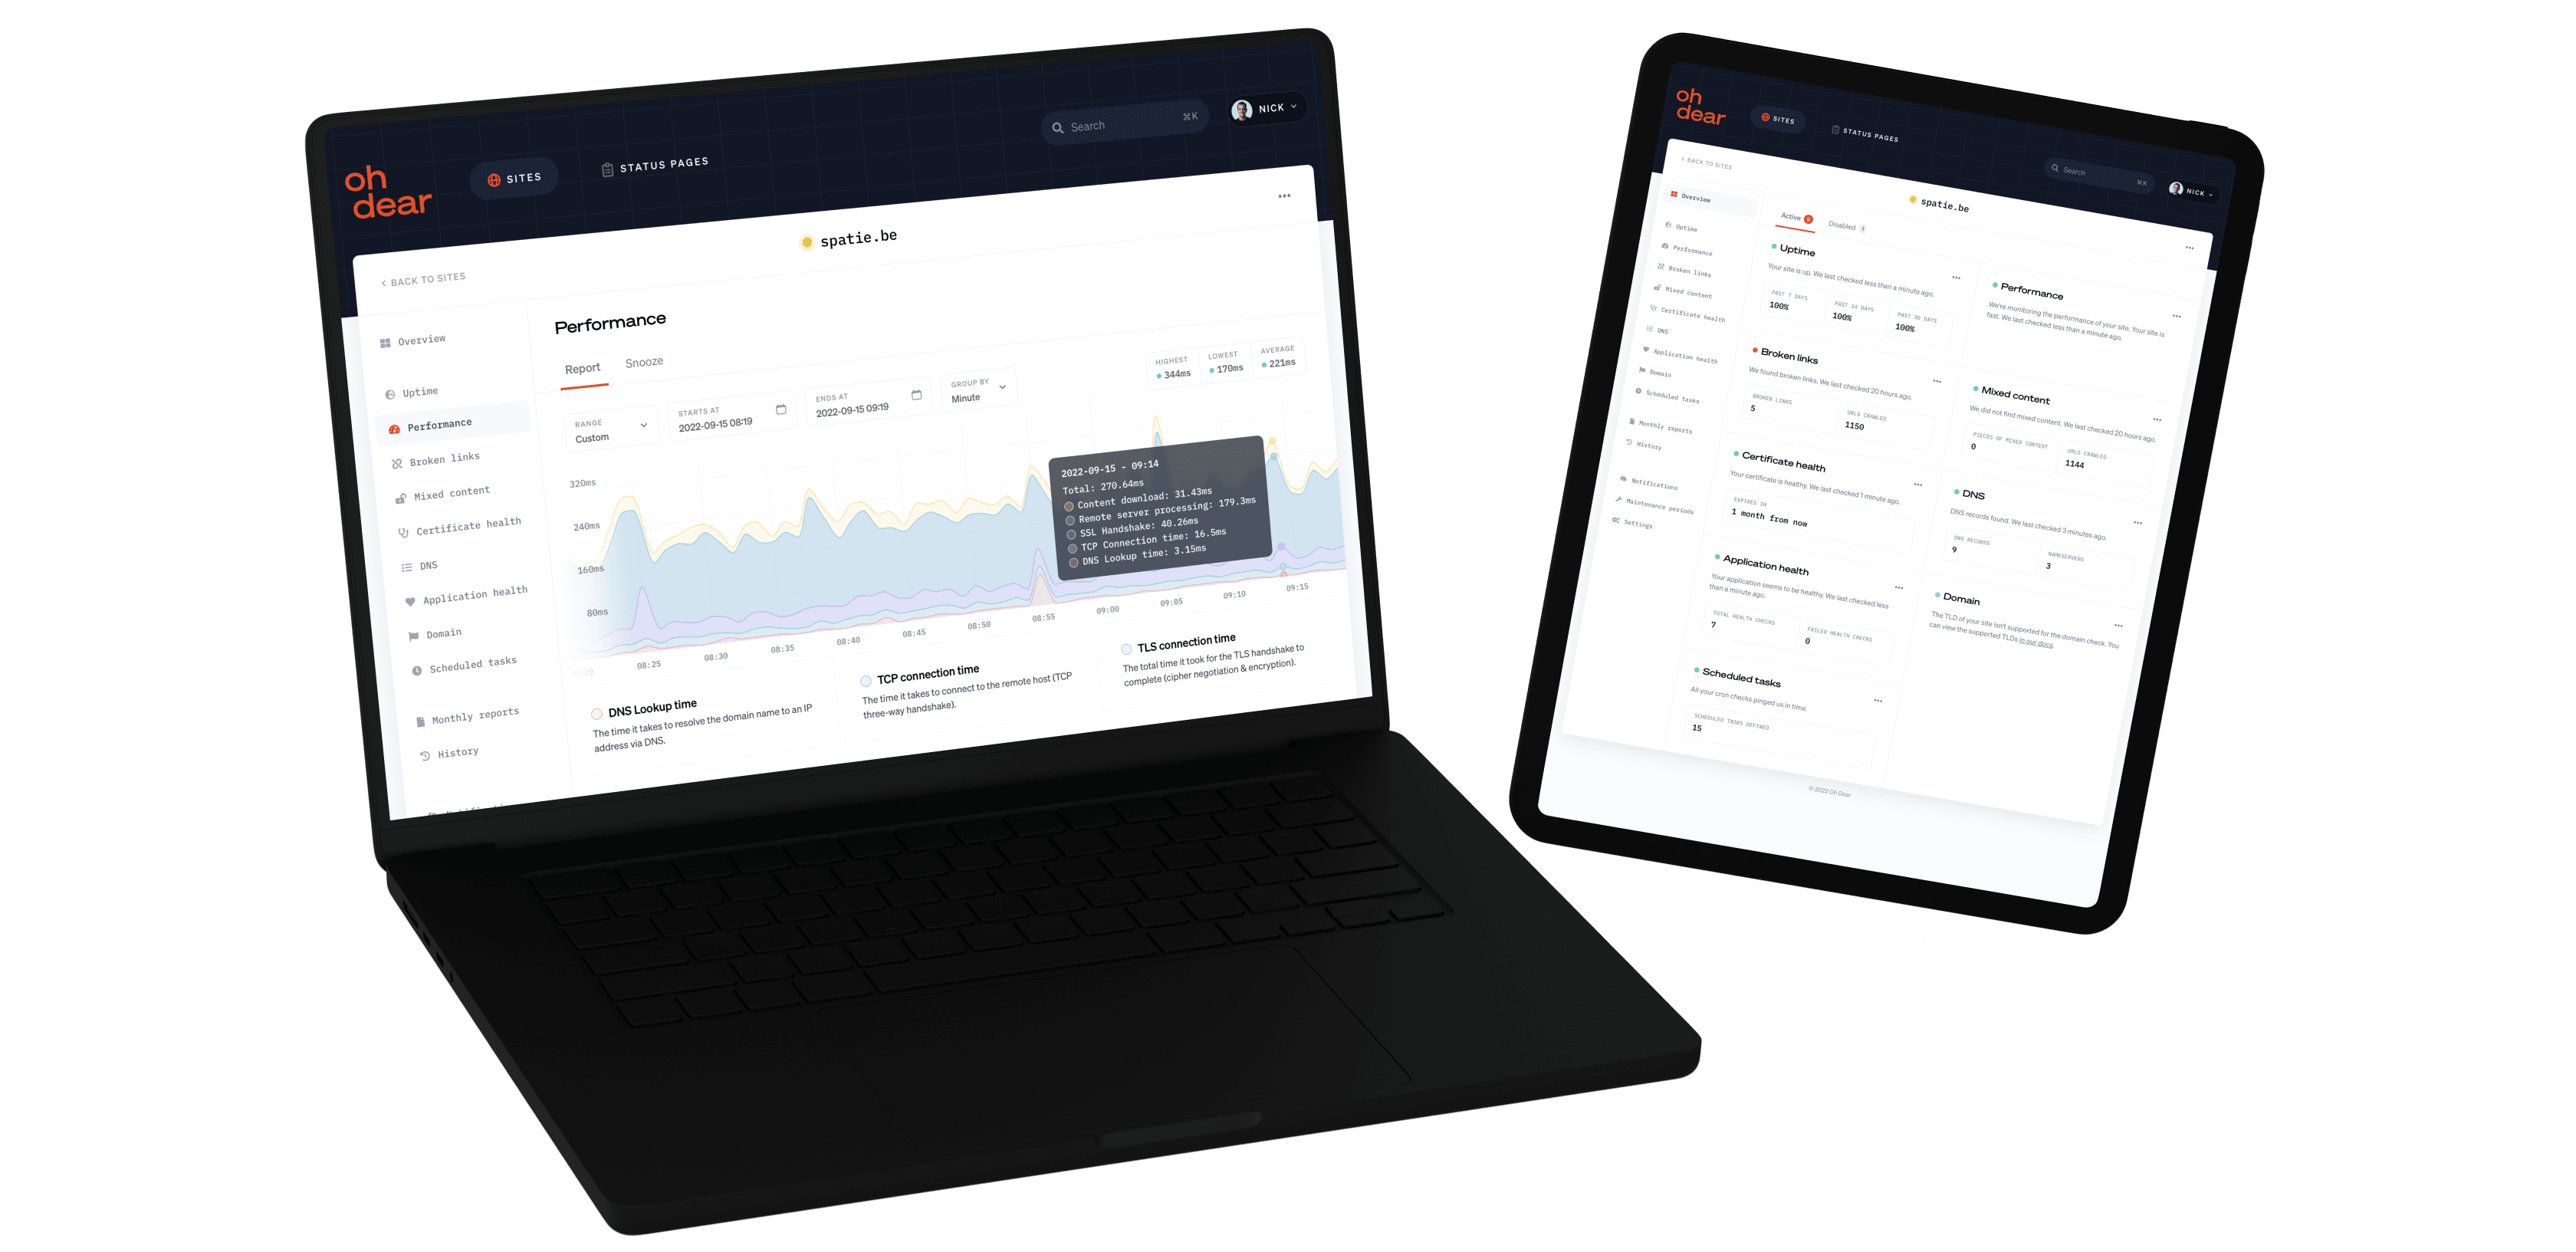
We also break down request timing: time spent establishing TCP connection, SSL handshake duration, time to first byte, content download time. This reveals where slowdowns occur - is it network latency, SSL negotiation, slow server processing, or large response bodies?
Share this data privately with your team, hosting provider, or CDN support. No more back-and-forth asking for details - everything they need to diagnose and fix the issue is in one shareable link.
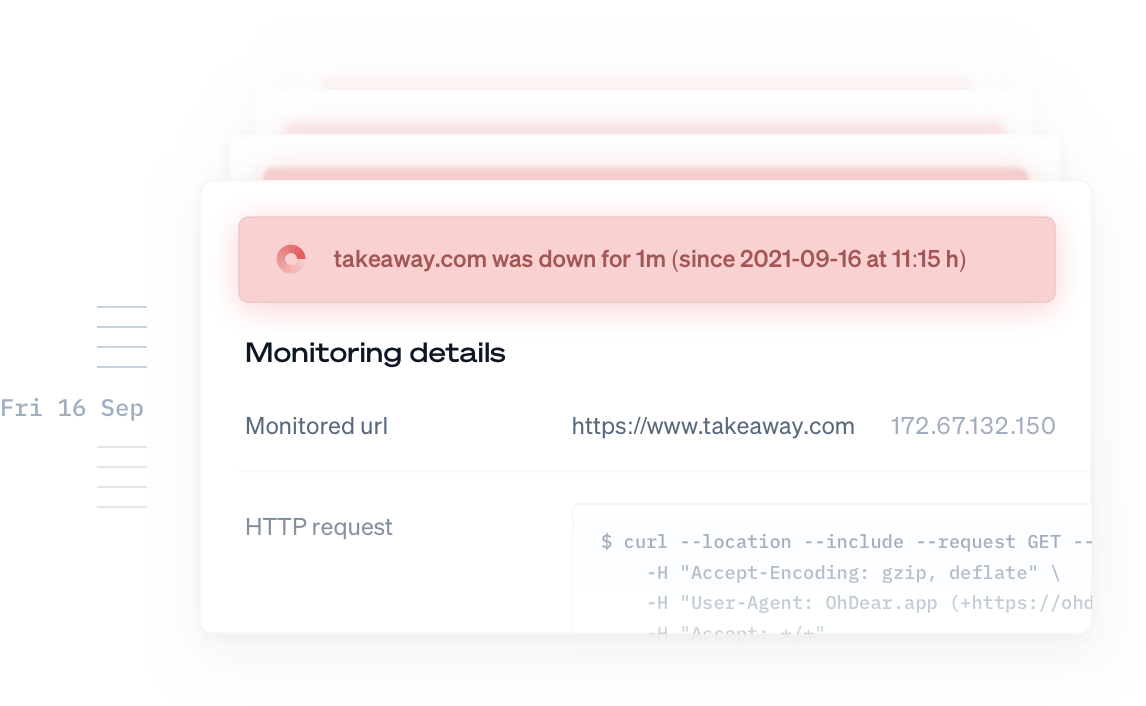
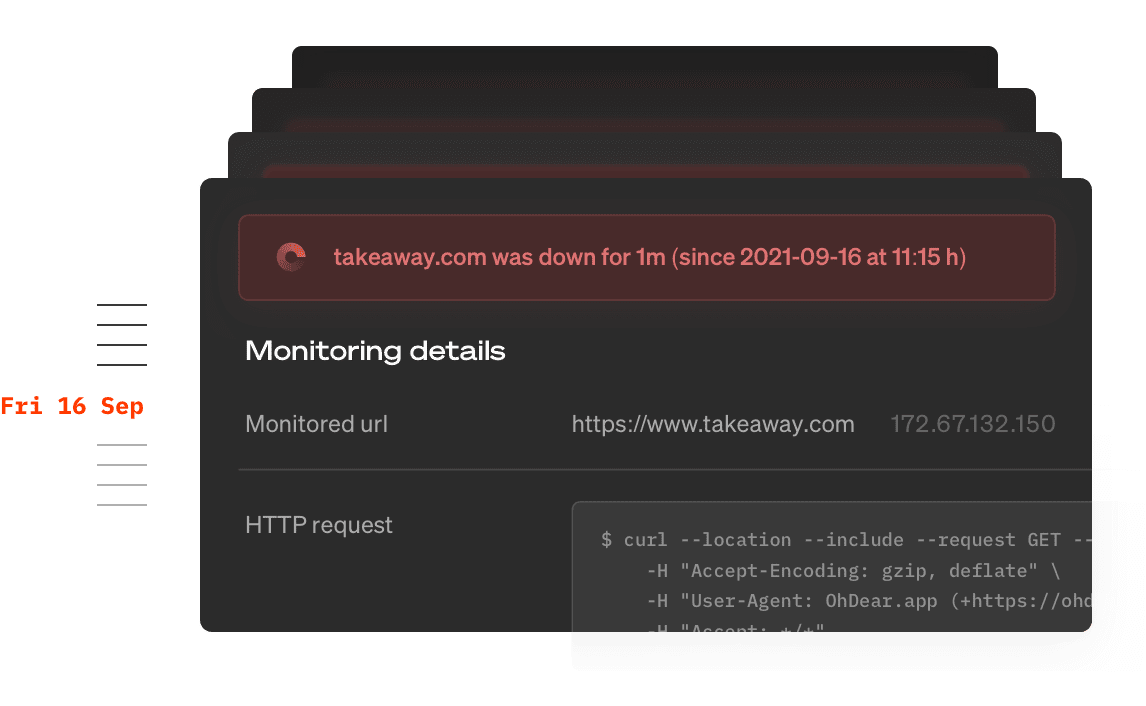
Spot patterns in downtime and performance
A single outage tells you something broke. Historical data tells you why it keeps breaking and how to prevent it.
Patterns emerge from the data: your site goes down every Tuesday at 3am (automated backup process overloading the server), response times spike every Monday morning (weekend cache expiration), or outages cluster around deploy times (specific code changes causing issues).
You'll see if problems are getting better or worse. Did adding more servers actually improve uptime? Did that caching layer reduce response times? Did switching hosting providers solve the recurring outages? The data shows you what's working.
Historical trends also prove reliability to stakeholders. Show clients or management concrete uptime percentages, response time improvements, and incident reduction over time. Turn monitoring data into evidence of infrastructure investments paying off.


Who needs uptime monitoring?
E-commerce businesses where every minute of downtime means lost sales. If customers can't complete checkout, revenue goes to zero instantly.
SaaS companies with uptime SLAs. Missing your 99.9% guarantee means refunds, penalties, and customers questioning your reliability.
Agencies managing client sites who need to know about problems before clients do. Proactive fixes protect your reputation and client relationships.
On-call engineers who want to sleep through the night. Early warnings during business hours beat emergency pages at 3am.
Marketing teams running campaigns where traffic spikes can overwhelm servers. Catch performance degradation before your biggest traffic day becomes your worst outage.
Anyone with a website that matters to their business. If downtime costs you money, customers, or reputation, you need monitoring.
What uptime monitoring checks (and what it doesn't)
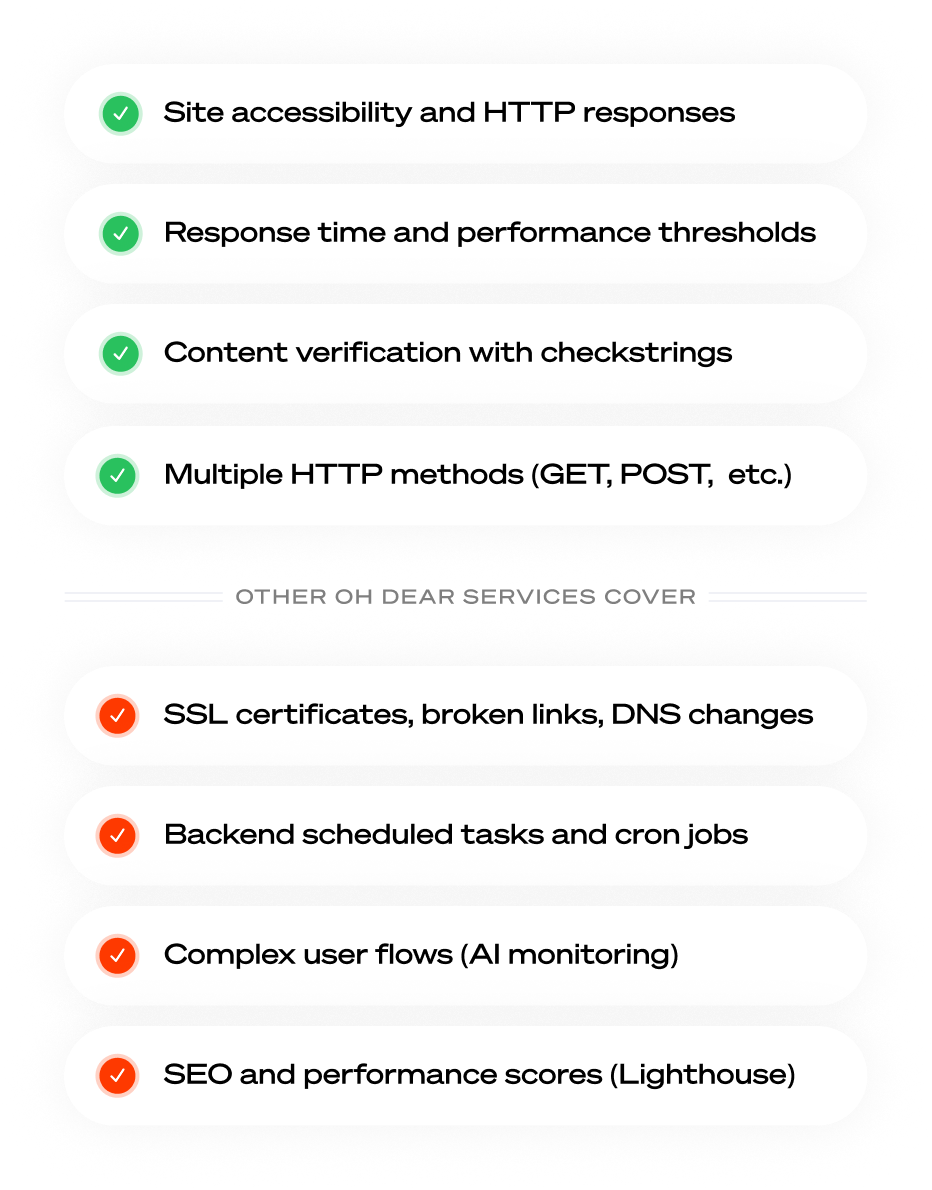
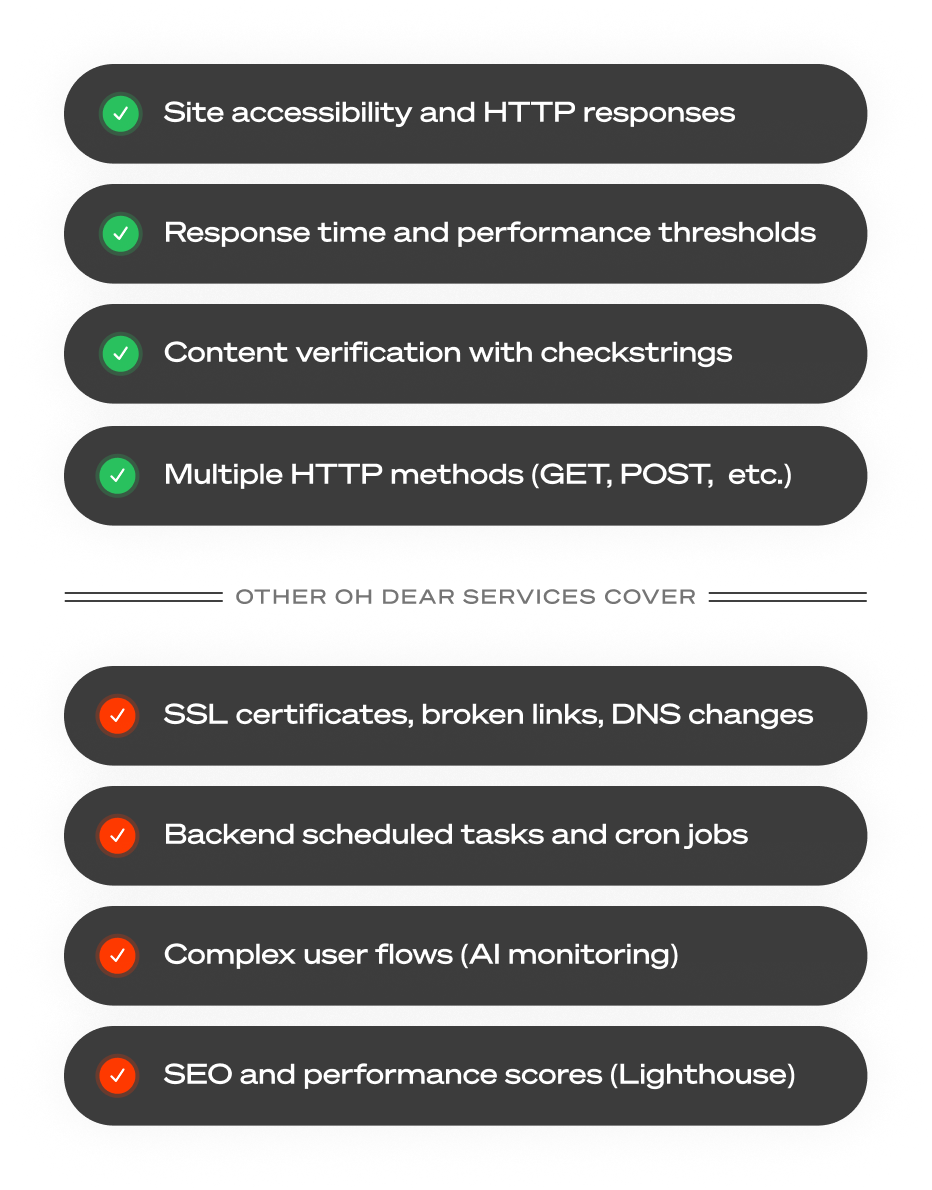
Uptime monitoring excels at one thing: telling you if your website is accessible and responding correctly. It checks HTTP status codes, response times, and page content from external locations - exactly what your customers experience when they visit your site.
What it checks: HTTP/HTTPS availability, response codes (200, 404, 500, etc.), response time performance, specific page content (checkstrings), and whether your site loads within acceptable timeframes.
It won't check everything, but we have you covered with SSL certificate expiration, broken links on your site, DNS record changes, backend scheduled tasks, complex user flows like checkout or login, or SEO/performance scores.
Think of uptime monitoring as your foundation - it tells you if your site is reachable. Our other monitoring types build on that foundation to catch everything else that can break.
Feature-by-feature comparisons with other uptime monitors are maintained for the most common alternatives.


Security-First Monitoring
Monitor your websites and internal systems safely by restricting access to Oh Dear's fixed IP addresses only. No need to expose systems publicly for monitoring.
Configure your firewalls, security groups, and access control lists to allow HTTP/HTTPS traffic exclusively from Oh Dear's monitoring servers, maintaining your security posture while ensuring comprehensive uptime monitoring coverage.
Our static IP addresses don't change often, providing stable security rules that won't break over time. Monitor internal applications, staging environments, and critical infrastructure without creating security vulnerabilities.
- Get our complete list of static IP addresses for secure monitoring. Perfect for firewall rules and security group configurations. View our IP addresses.
| Service | Value |
|---|---|
| Postgres | available on port 5432 |
| Redis | available on port 6379 |
Redis service is publicly accessible
Redis service is publicly accessible
Verified from Paris, France and Frankfurt
Redis service is publicly accessible
Postgres service is publicly accessible. full report: https://app.opsgenie.com/monitors/83/checks/411
Redis service is publicly accessible. verified from Paris, France and Frankfurt
Services monitoring has been successfully enabled. We'll notify you when something goes wrong.
ntfy
Postgres service is publicly accessible. full report: https://ohdear.app/monitors/83/checks/411
ntfy
Redis service is publicly accessible. verified from Paris, France and Frankfurt
ntfy
ntfy has been successfully enabled. We'll notify you when something goes wrong.
Postgres service is publicly accessible. full report: https://app.opsgenie.com/monitors/83/checks/411
Redis service is publicly accessible. verified from Paris, France and Frankfurt
Services monitoring has been successfully enabled. We'll notify you when something goes wrong.
$_TOKEN="your API token"
$ curl -X GET "https://notifyservicexyz.com/api/alert/urlxyzcom" \
-H "Authorization: Bearer $_TOKEN" \
-H "Accept: application/json" \
-H "Content-Type: application/json"
Postgres service is publicly accessible. full report: https://app.opsgenie.com/monitors/83/checks/411
Redis service is publicly accessible. verified from Paris, France and Frankfurt
Services monitoring has been successfully enabled. We'll notify you when something goes wrong.
Postgres service is publicly accessible. full report: https://app.opsgenie.com/monitors/83/checks/411
Redis service is publicly accessible. verified from Paris, France and Frankfurt
Services monitoring has been successfully enabled. We'll notify you when something goes wrong.
Reverse Monitoring & Compliance
Monitor services that should remain hidden for compliance and security reasons. Get immediate alerts when internal systems, staging environments, or sensitive infrastructure accidentally become publicly accessible via HTTP/HTTPS.
Compliance violations often occur when supposedly isolated systems become reachable due to configuration errors, network changes, or security misconfigurations that expose internal infrastructure.
Set up reverse monitoring to ensure your sensitive systems maintain their intended isolation and receive instant notifications if they become unexpectedly accessible from external networks.
- Perfect for PCI DSS, HIPAA, SOX compliance requirements where internal services must remain isolated. Monitor from multiple external locations to ensure your security perimeter remains intact.
Stop worrying, start monitoring
Start a no-strings-attached 10-day free trial. You're all set in less than a minute. (No credit card needed.)
Not convinced yet? Need help? Get in touch via support@ohdear.app.
Let's get technical (if you're into that)
You don't need to be computer savvy to set up our tool. But if you are, we're happy to explain exactly how it works and how you can customize Oh Dear to your specific needs.
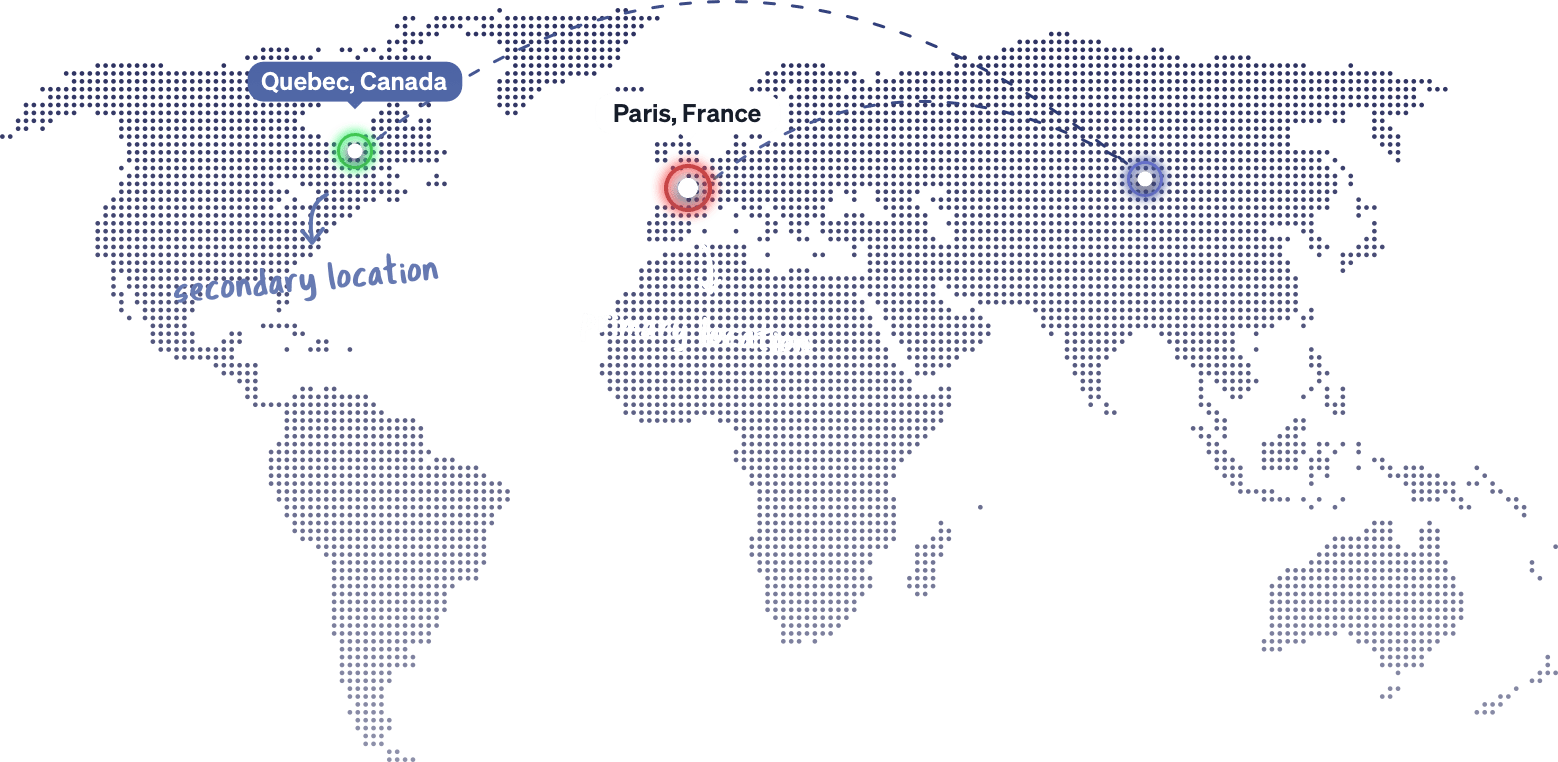

Multi-location monitoring
Each site is monitored from a primary location and verified from a secondary location. You can choose your primary location from within the Oh Dear dashboard.
If the primary location reports an error to Oh Dear, the secondary location is used to verify the problem. We'll only trigger an alert if both the primary and the secondary checks report the site as down. This prevents any false alerts.
HTTP/200 response
If we fail to receive an HTTP/200 response within a reasonable timeframe, we mark your site as down. When we see website failures for 2 minutes in a row, we send out notifications so you can intervene. This prevents monitoring flaps and false positives.
You can change the timing threshold in your settings. Prefer to get alerted after 5 minutes instead of 2? Not a problem. Our downtime reports give you all the details to quickly verify and troubleshoot any alert.
In our report you'll find useful commands to replicate our monitoring, this allows to you see exactly what we see.
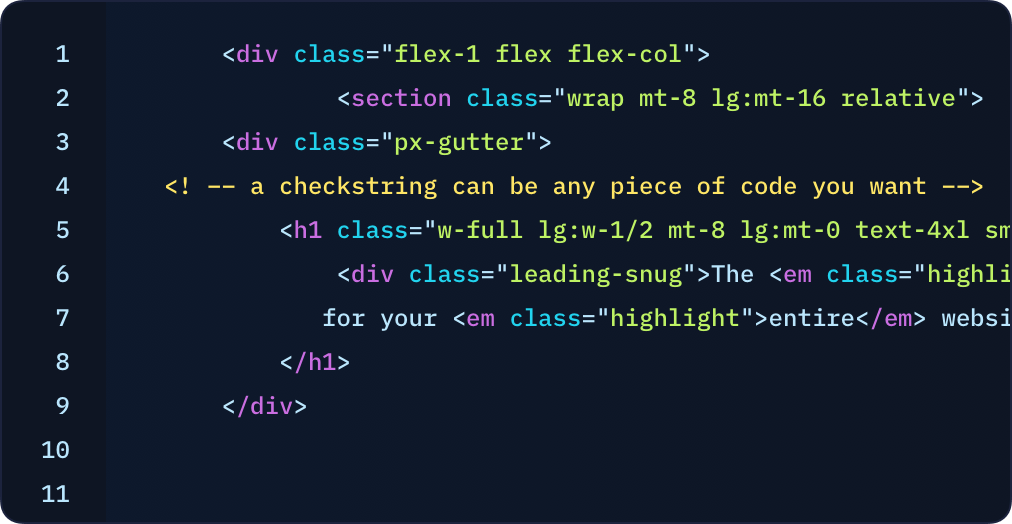
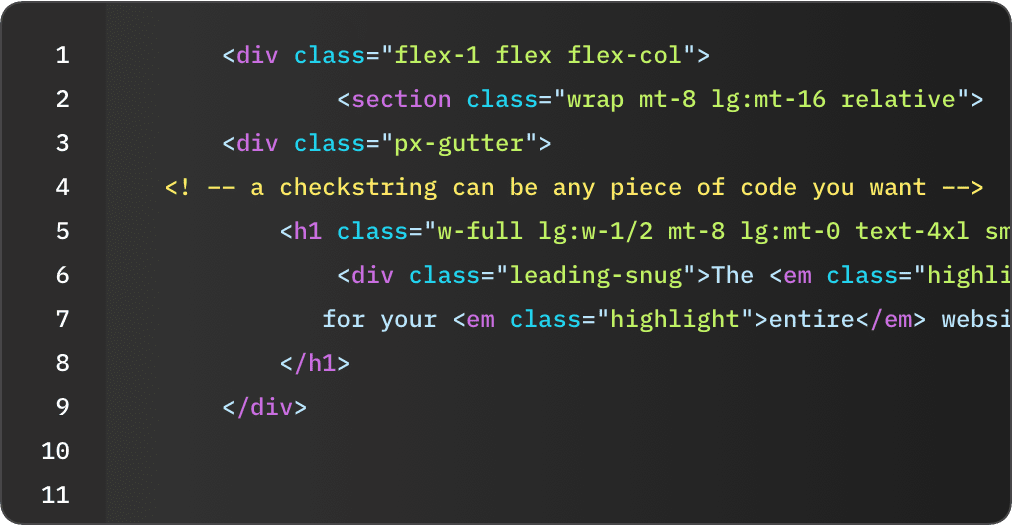
Content verification
Is just monitoring a status code not enough? We can verify the existence of a piece of text on the page too (a so called "checkstring"). If we receive an HTTP/200, but the checkstring is missing in the source code, we'll mark the site as down.
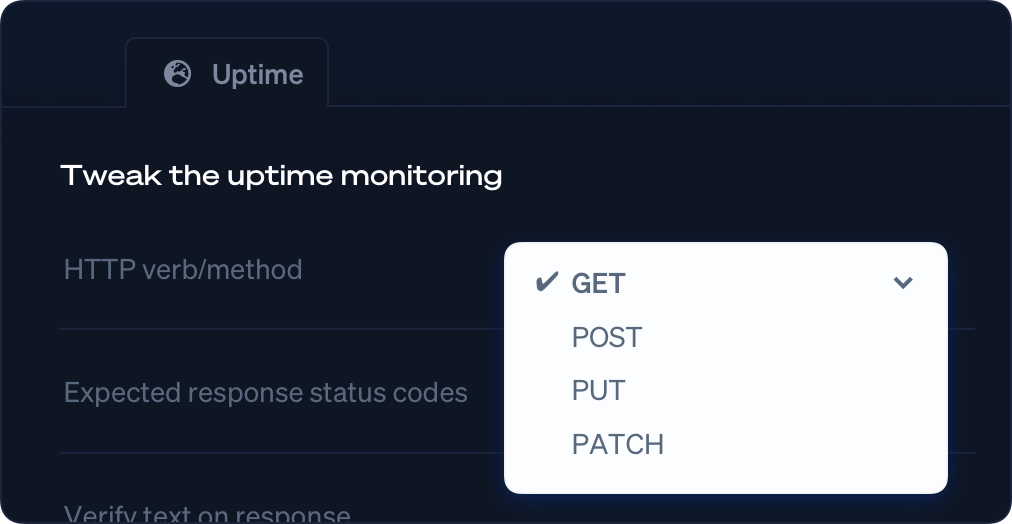
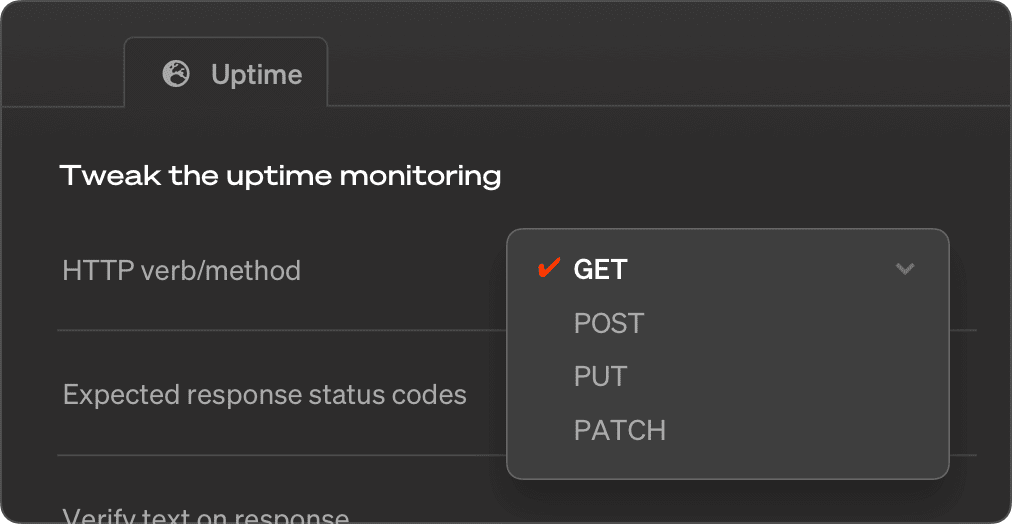
Monitoring beyond a GET request
By default we monitor using a GET HTTP call, but you can also change this to POST, PUT or PATCH.
Each method can have its own form payload. This allows you to simulate a form submission and monitor search results, contact forms, API endpoints, ...
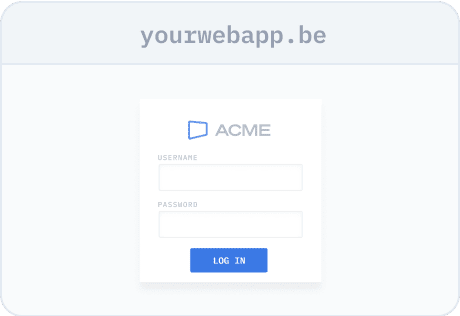
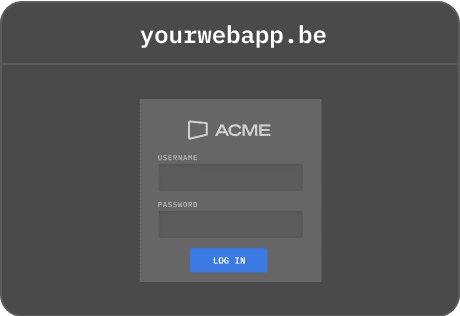
You could even perform a website login through a POST call and verify the account page loads properly.
Frequently asked questions


What is uptime monitoring?
Uptime monitoring is software that continuously checks whether your website, server, or application is reachable, and alerts you the moment it isn't. Instead of you refreshing a browser tab, a monitoring service checks from servers around the world. Oh Dear checks every minute, verifies every failure from a second location so one flaky network doesn't trigger a false alarm, and notifies you through email, Slack, SMS, or a dozen other channels.
What are the benefits of uptime monitoring?
You find out first, not from a customer email or from Twitter. You minimize downtime, because the faster you know, the faster you fix. You can back up SLA claims with real data, spot recurring patterns (deploy times, traffic spikes, specific regions), and run a status page powered by real checks that shows customers you take reliability seriously.
How do I track site uptime?
Have a monitoring service send regular requests to your site and record whether each one succeeds. Done well, that means checks every minute from multiple locations, verification from a second location before an outage is recorded, instant alerts, and history you can turn into monthly uptime percentages. Oh Dear does all of that out of the box, and keeps every incident for the life of the monitor.
How does Oh Dear detect website downtime?
We request your site every minute from multiple locations around the world. When a check fails, we verify the failure from a second location before alerting you, so a single flaky network hop never wakes you at 3am.
How fast will I know my site is down?
Within a couple of minutes at worst. Checks run every minute, a failure is confirmed from a second location, and the alert goes out immediately on every channel you've connected.
How do I get an alert the moment my website goes down?
Add your site and pick your channels: email, SMS, Slack, Microsoft Teams, Discord, Google Chat, Telegram, Pushover, ntfy, Opsgenie, PagerDuty, and webhooks. We verify the failure and alert you straight away, with nothing to install on your servers.
Can Oh Dear email me about 404 and 500 errors?
Yes. Uptime checks catch server errors (5xx) on the endpoints you monitor, and the site crawler finds broken pages (404s) across your whole site. Both can notify you by email or any other channel you use.
What should a website uptime monitoring service include?
Look for one-minute checks, failure verification from multiple locations, content checks on the response, SSL and DNS monitoring in the same tool, alerts on the channels your team already uses, and uptime history you can show stakeholders. Oh Dear includes all of these on every plan.
Is Oh Dear a good fit for a small SaaS or ecommerce store?
Yes. You get external monitoring with no agent to install, content checks that catch a broken checkout or signup flow, uptime history for your SLAs, and a status page, all without enterprise pricing.
Can agencies monitor uptime for client websites?
Yes. Agencies and freelancers monitor all their client sites from one account, invite their whole team (every plan includes unlimited users), route alerts per site, and give each client a branded status page and uptime reports.
Can I monitor uptime from European locations?
Yes. Oh Dear is a European (Belgian) company with GDPR-friendly data handling, and you decide where we check from. Keep your checks on European locations like Frankfurt or London if that's what your compliance needs, or run them from anywhere in the world if your audience is global. The choice is yours, per site.
Can I see my website's uptime history?
Yes. Oh Dear keeps a history of your uptime and every downtime period, including the cause, so you can report exact uptime percentages for SLAs.
Can I get automated uptime reports?
Yes. Oh Dear can email you a monthly uptime report, so clients and stakeholders get the numbers without logging in.
Do I need to install an agent?
No. All checks run from Oh Dear's own servers, outside your infrastructure. There's nothing to install or maintain, and monitoring keeps working even when your whole stack is down.
Does Oh Dear offer free uptime monitoring?
For a quick one-off check, head to ohdear.app/up and we'll test whether your site is up from multiple locations, free and without signing up. That's a single point-in-time check, though. What Oh Dear is really built for is continuous monitoring: one-minute checks, verified from a second location, alerting you the moment your site goes down. You can use all of that free during the 10-day trial (no credit card needed), and after that plans are flat-priced, with no permanently free tier.
Wait, there's even more
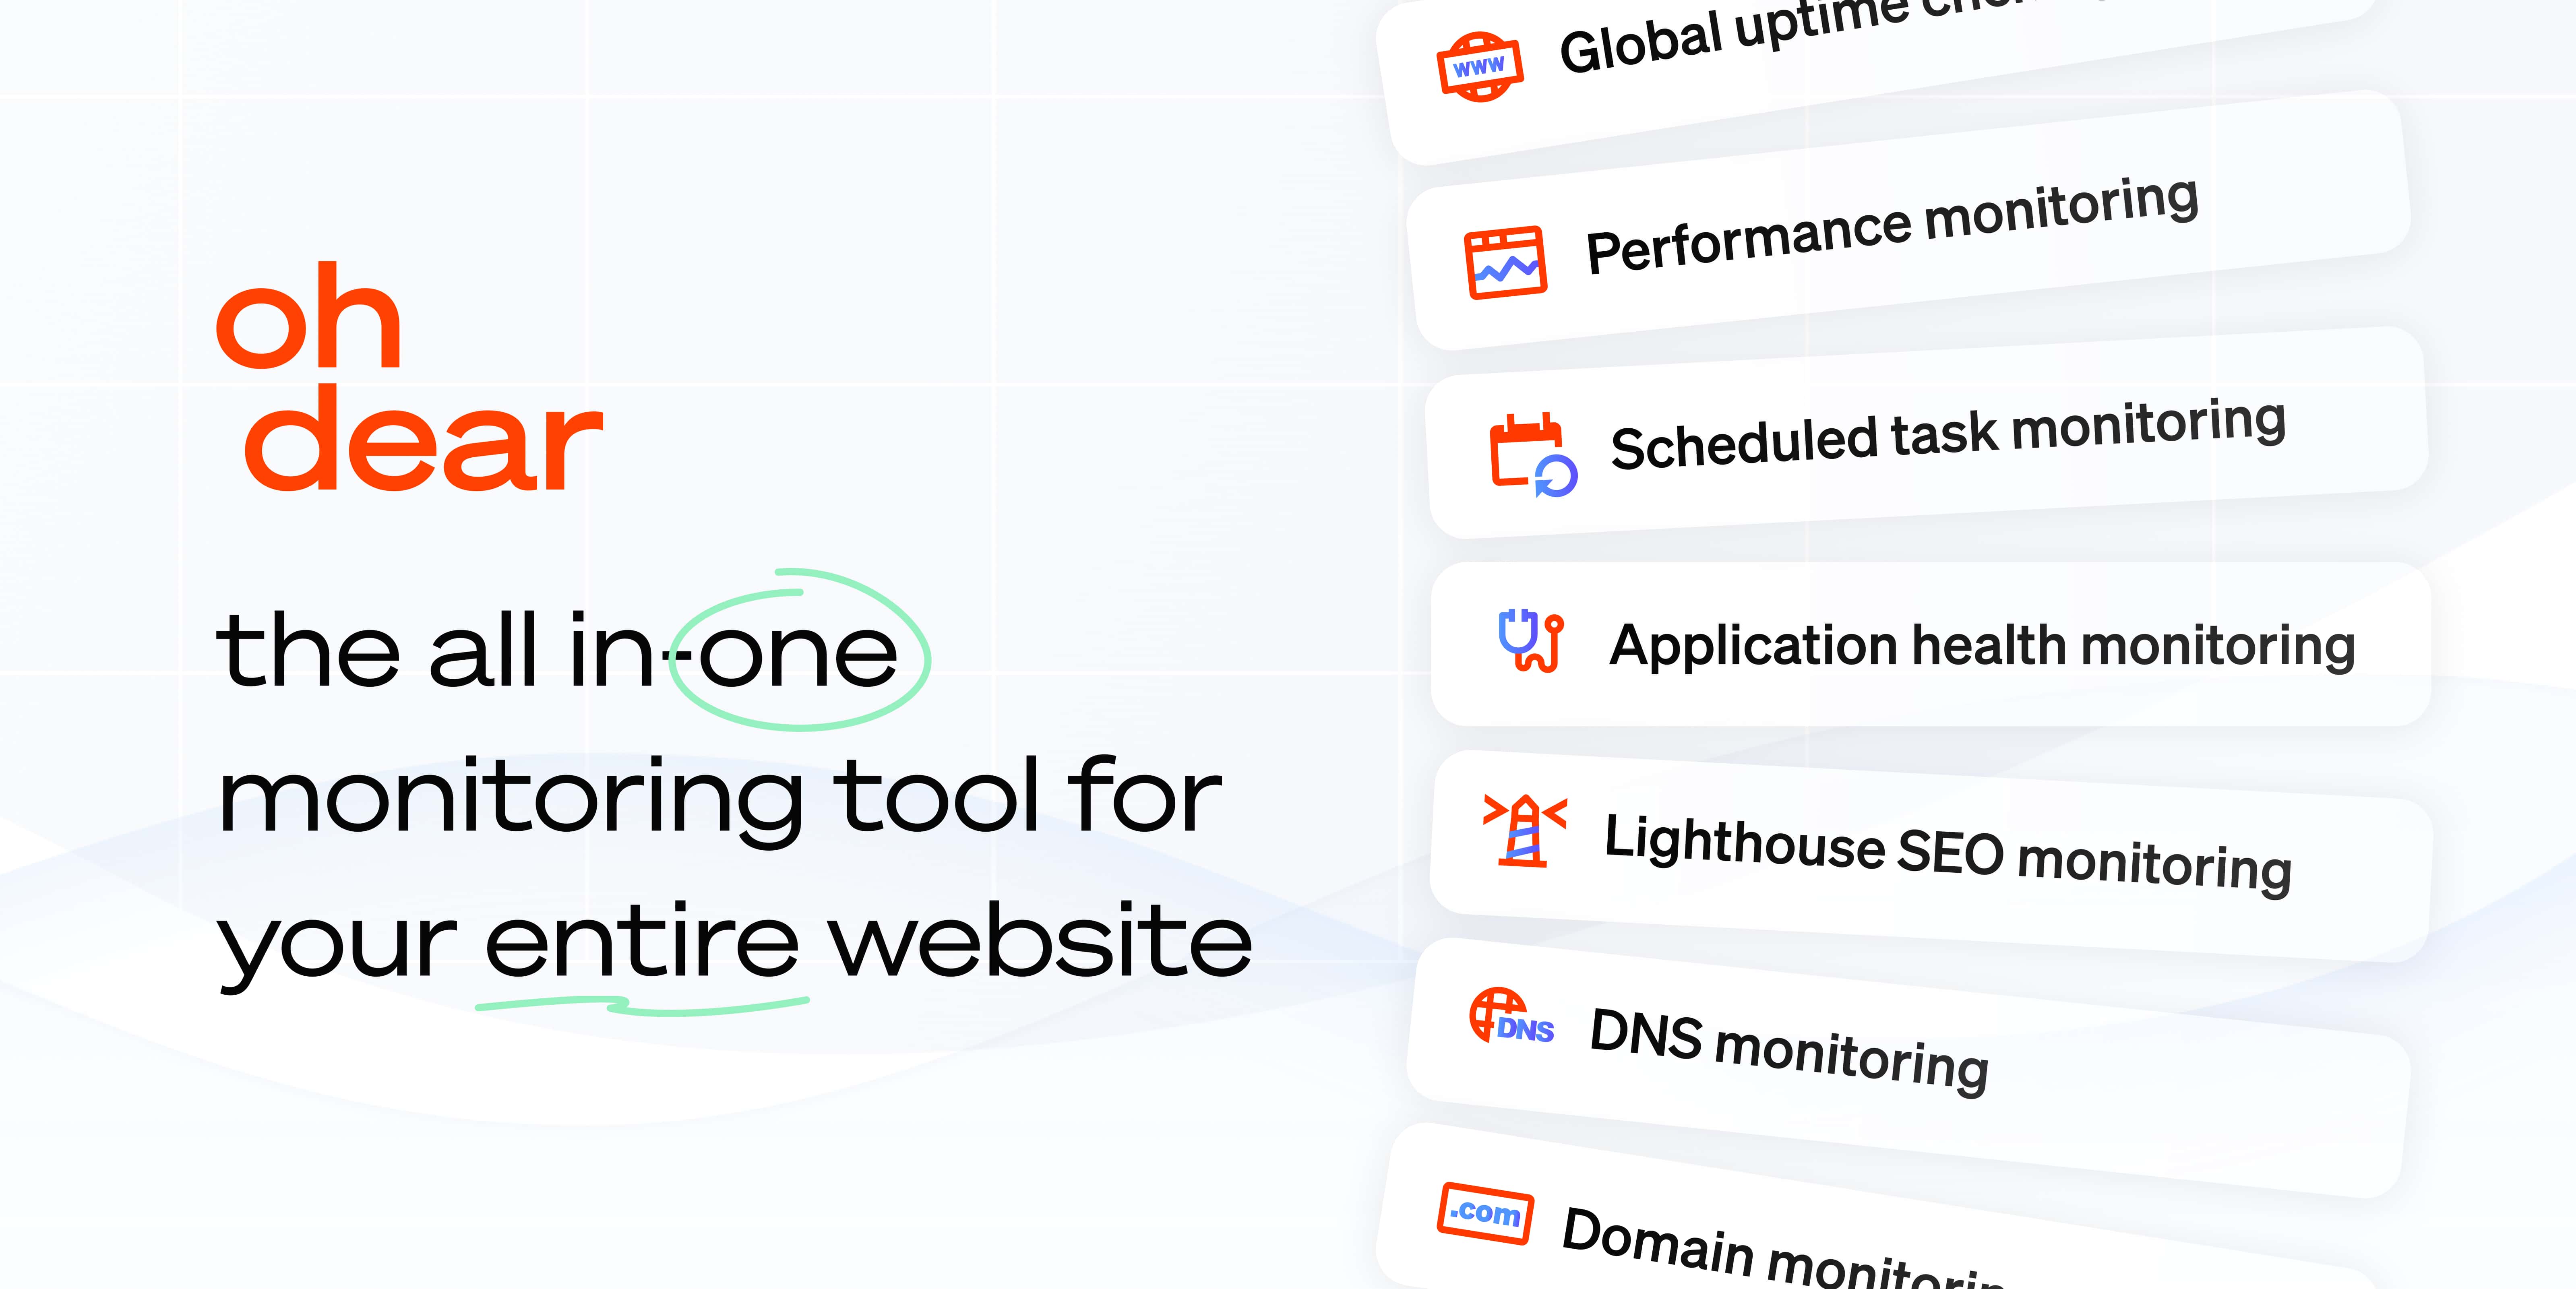
API & endpoint monitoring
Call your endpoints every minute and validate what they actually return: status codes, response bodies, headers and response times. Webhooks and scheduled jobs included.
Continuous certificate monitoring
SSL certificates are essential in website security. We check all your certificate expiration dates & alert any change we detect.
Performance monitoring
We provide highly detailed performance monitoring and insights. We'll notify you as soon as we detect your website is getting slow.


Fast and insightful notifications
Get notified instantly as soon as we detect an issue or an important change. Enable any channel you use, you're in full control.
Scheduled task monitoring
Your cron jobs (Linux) and scheduled tasks (Windows) are the heart of your data processing. We can monitor every single one of them.


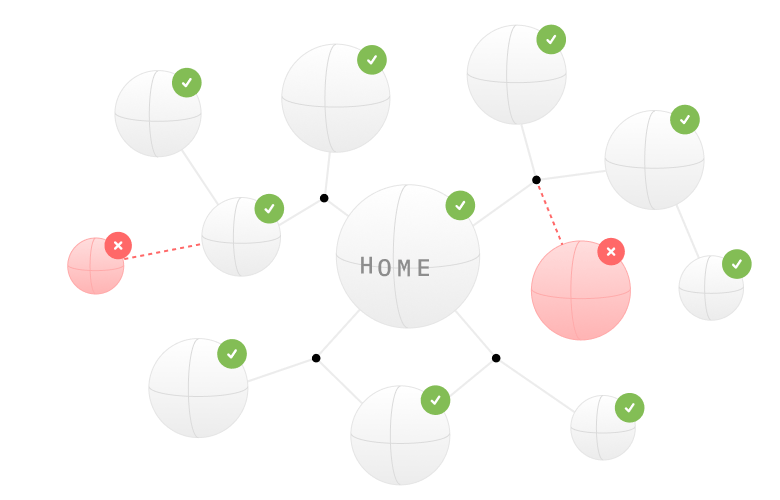
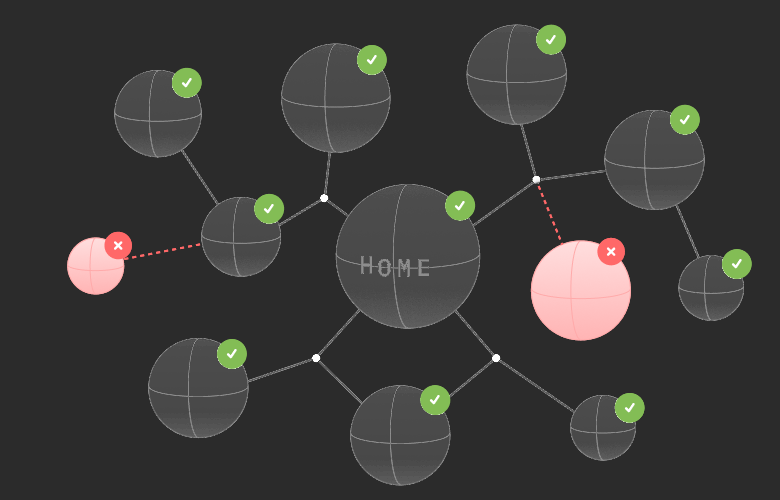
Broken page & mixed content
We crawl and index your entire website, just like Google. As soon as we detect a broken link on your site we will let you know.
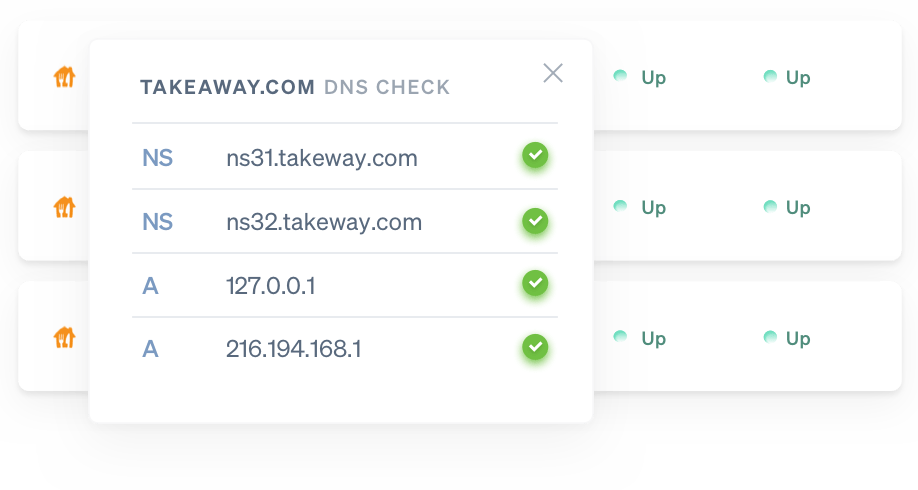
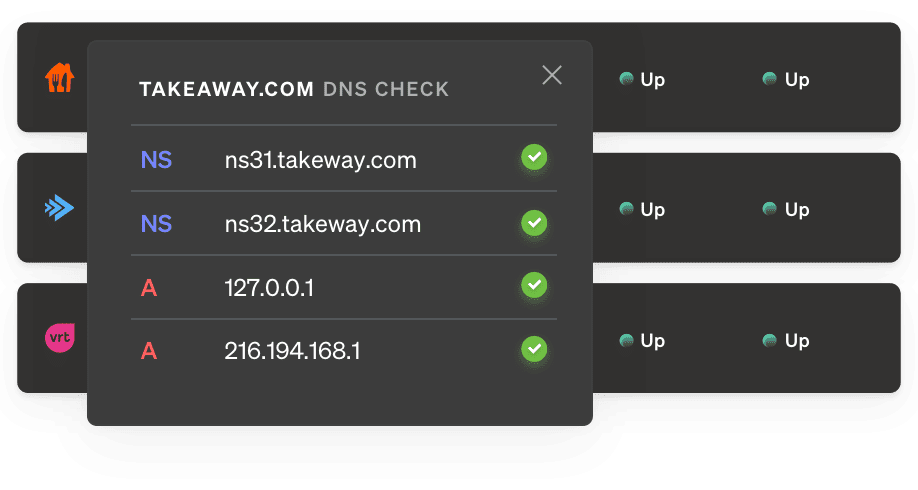
DNS record monitoring
Receive a notification whenever your DNS records are modified - intentionally or maliciously - so you can act and verify faster.

Application health monitoring
A lot can go wrong inside your app and server. Disk space may fill up, or the database may go down. We'll notify you when something is off.
Beautiful public status pages
In times of crisis, a public status page allows you to communicate to your clients. We'll host your status page so it's always available.
Domain monitoring
We can check how long your domain is still registered. If your renewal date is close, we'll notify you. This will avoid you losing your domain.
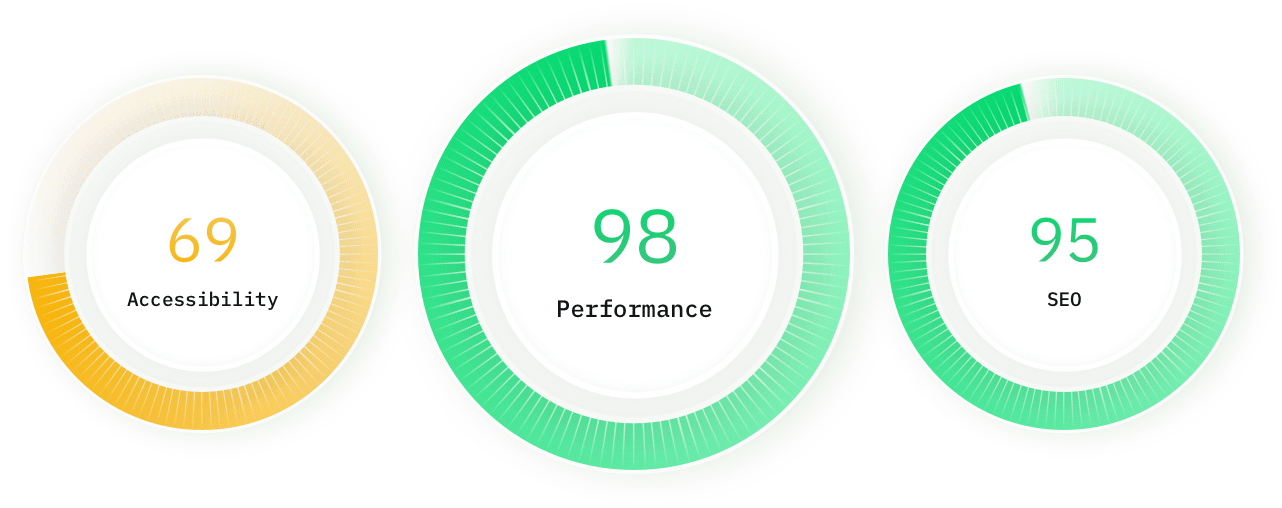
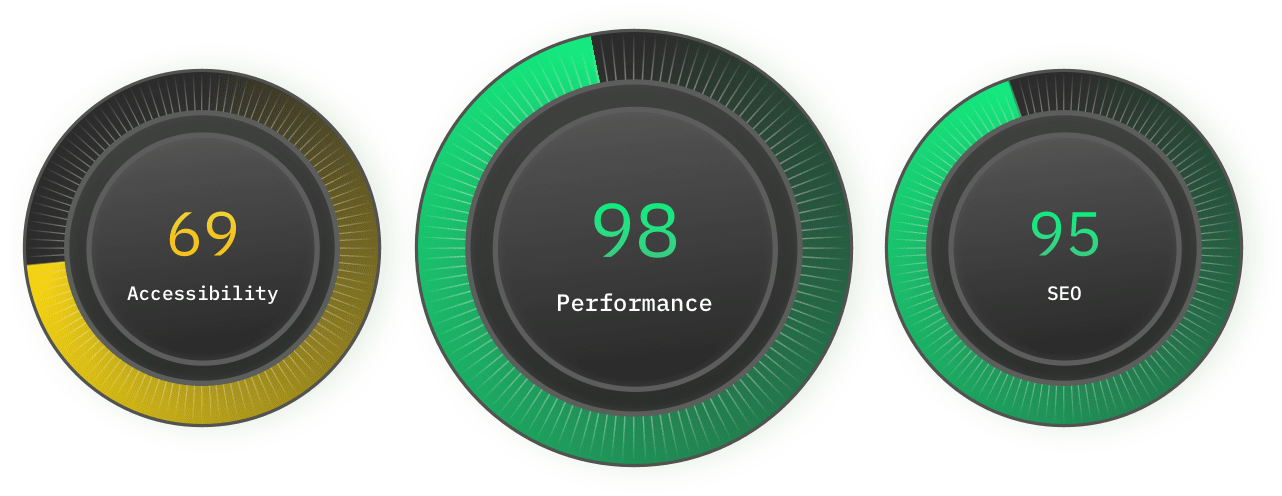
Lighthouse SEO monitoring
We track the speed & performance of your website over time. If we detect your website is suddenly slower, we'll let you know.
Sitemap monitoring
Elevate your SEO strategy and optimize your site. We analyse your sitemap health and check every URL for broken links.
Describe what you want to monitor
AI-powered monitoring
Use AI to verify anything you want on your websites and services with Oh Dear's AI-powered monitoring feature.
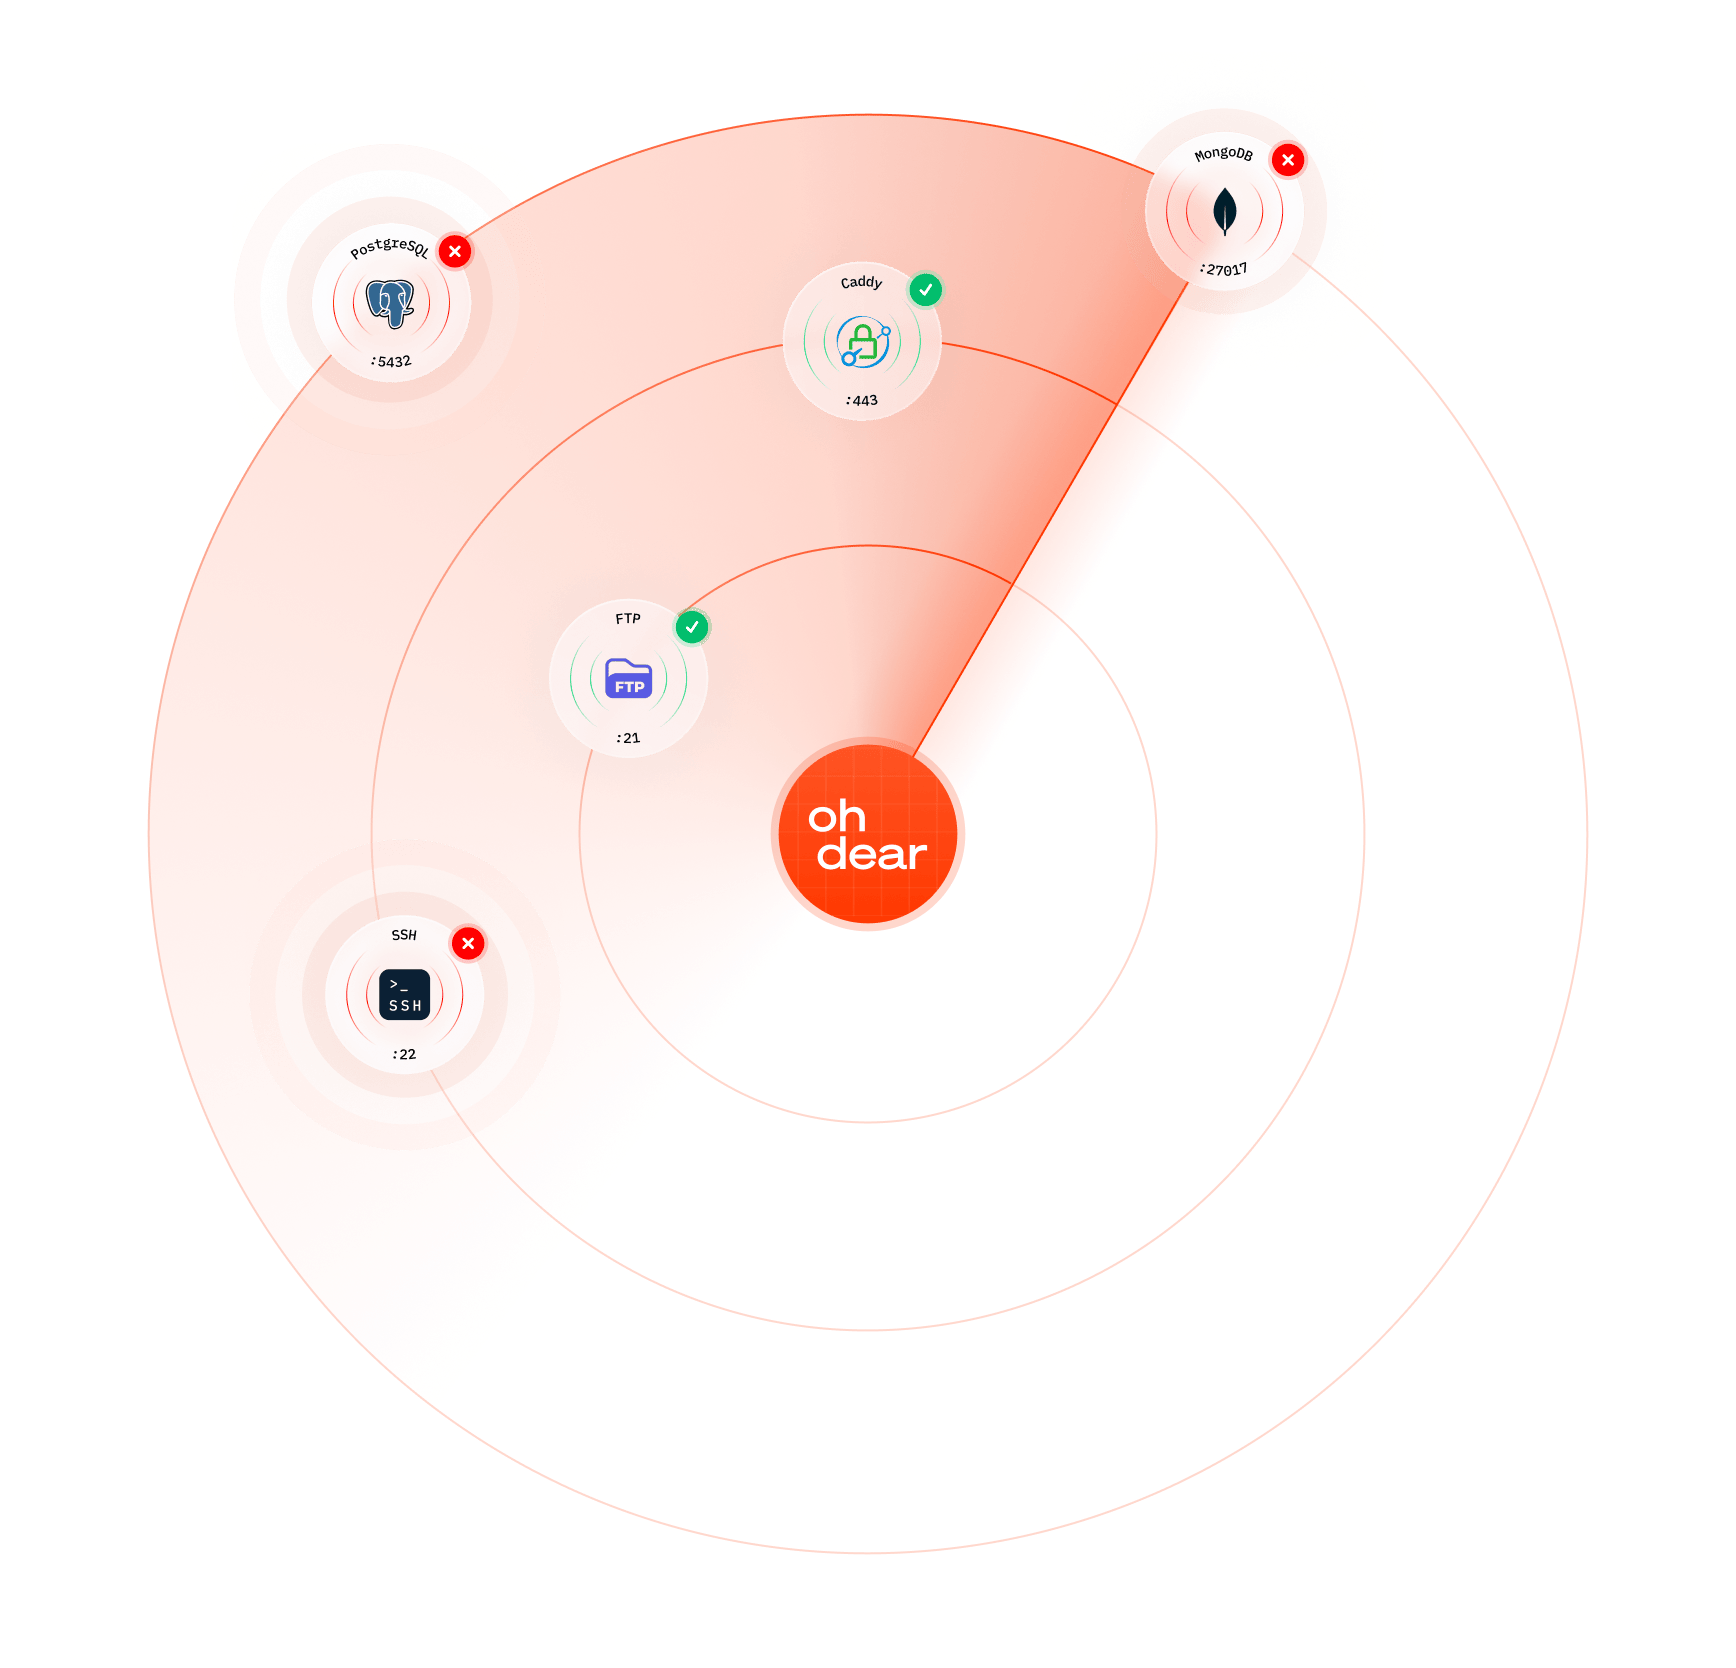
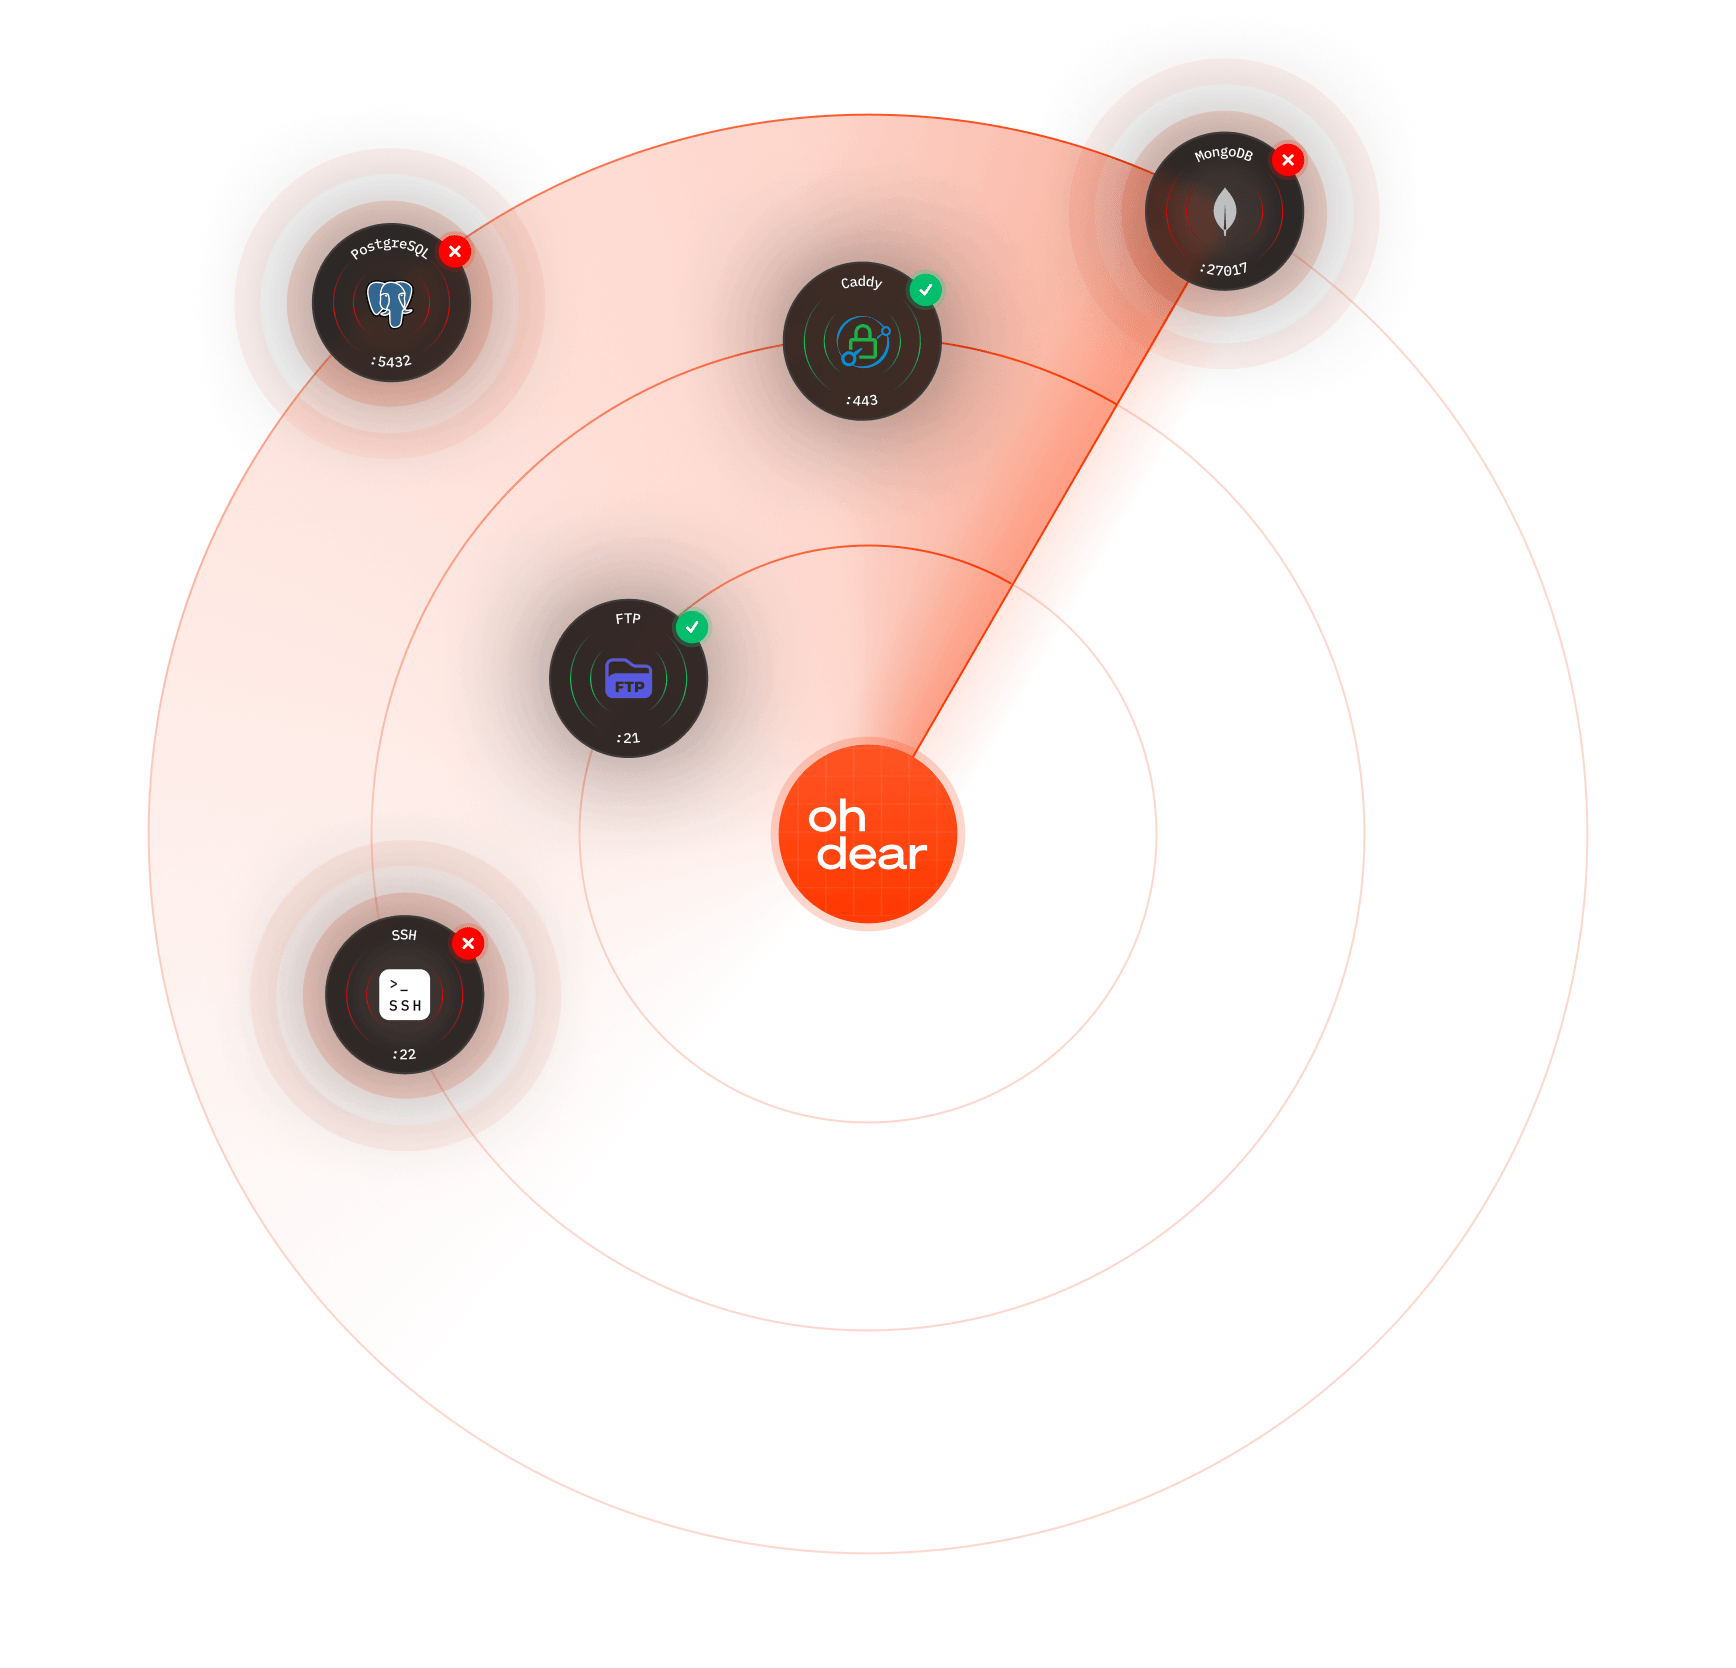
Port scanner
Define which ports should be open, and we scan all 65,535 ports on your server. Get alerted when expected ports go down or unexpected ports appear.
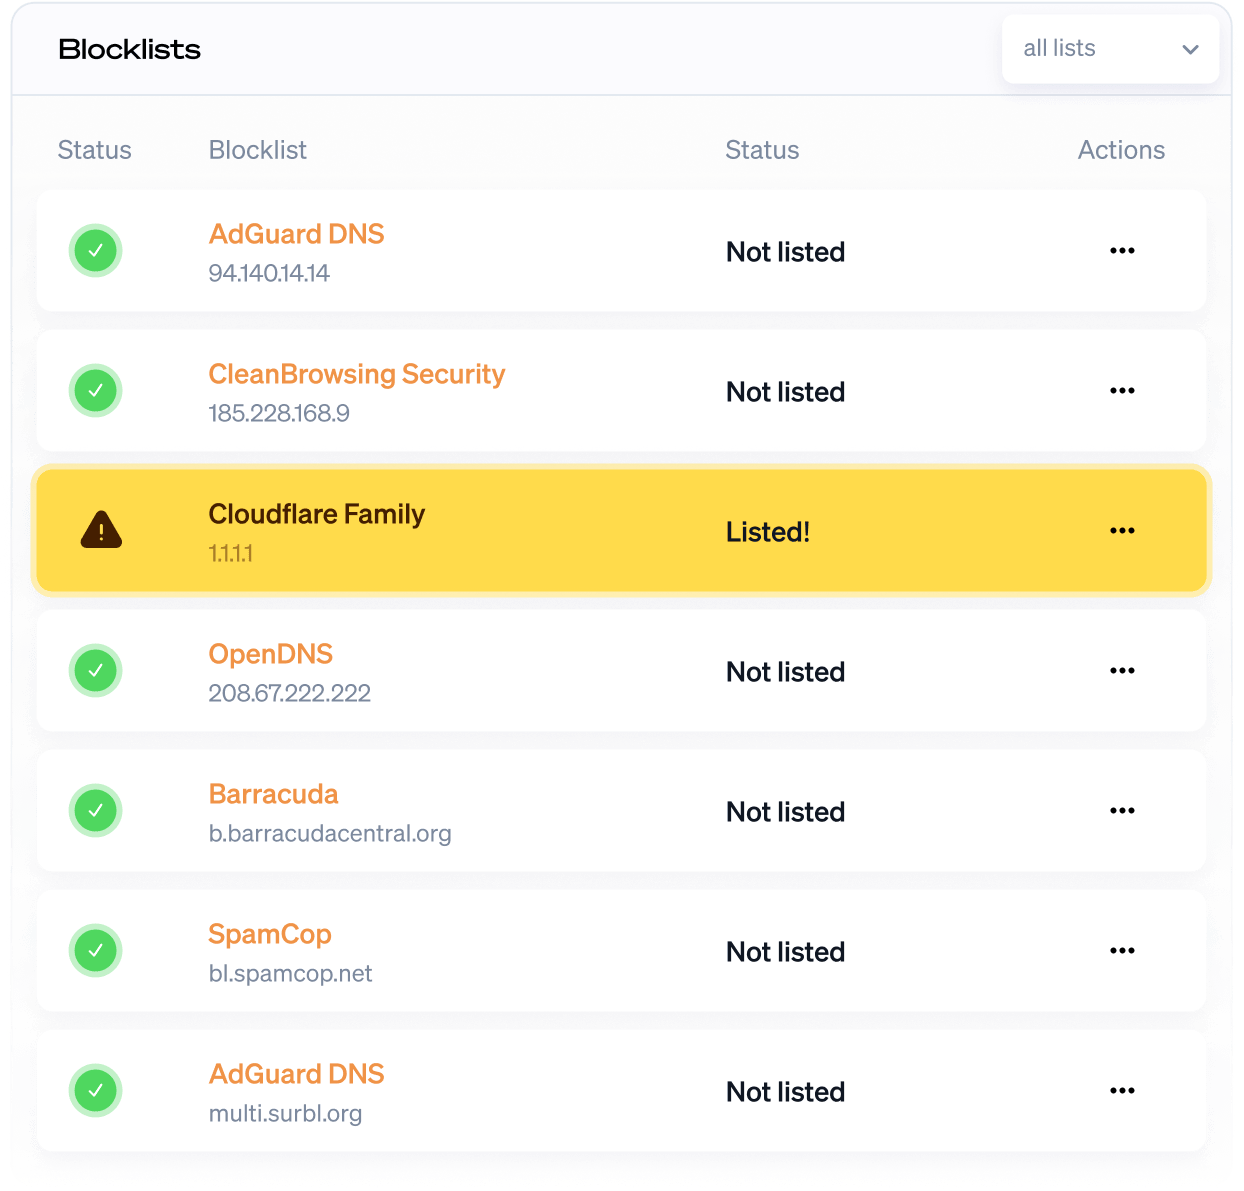
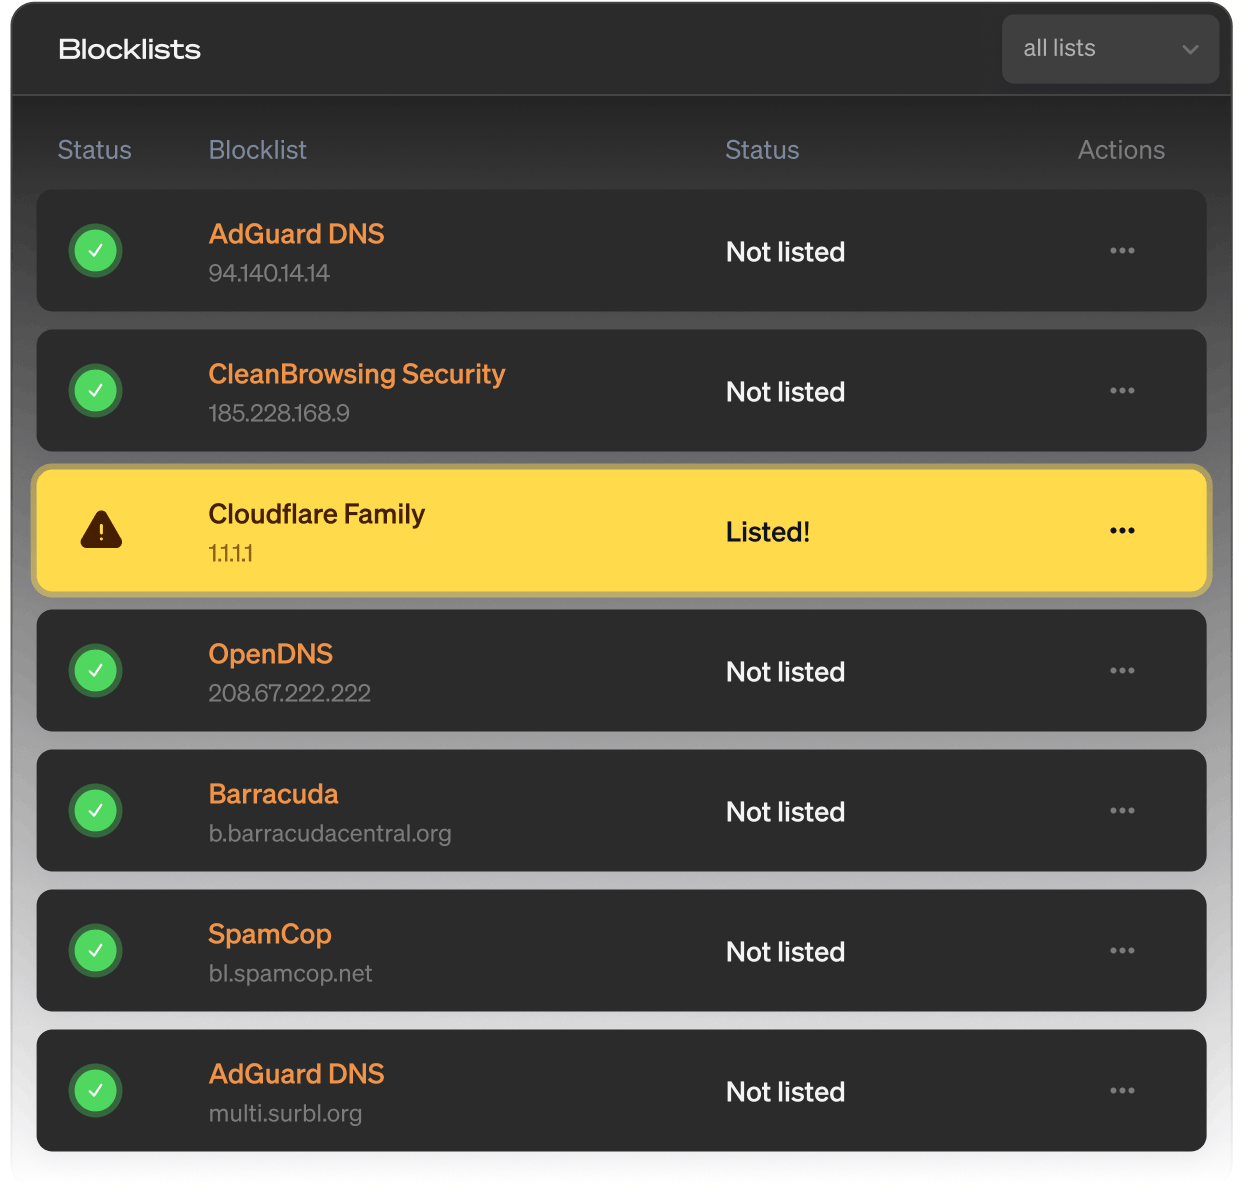
DNS blocklist monitoring
DNS blocklist monitoring helps you stay off spam and ad-block lists. Get notified when your DNS is blocked by a blacklist.
Single Sign-On (SSO)
Connect Oh Dear to your identity provider. Your team signs in with the credentials they already use.
GDPR & EU data residency
Oh Dear is a Belgian company. Your monitoring data is stored in the EU, with a signable DPA and a public subprocessor list.
Start monitoring instantly
Start a no-strings-attached 10-day free trial. You're all set in less than a minute. (No credit card needed.)
Not convinced yet? Need help? Get in touch via support@ohdear.app.