A different view for the performance timings of an uptime monitor
Published on November 4, 2025 by Mattias Geniar
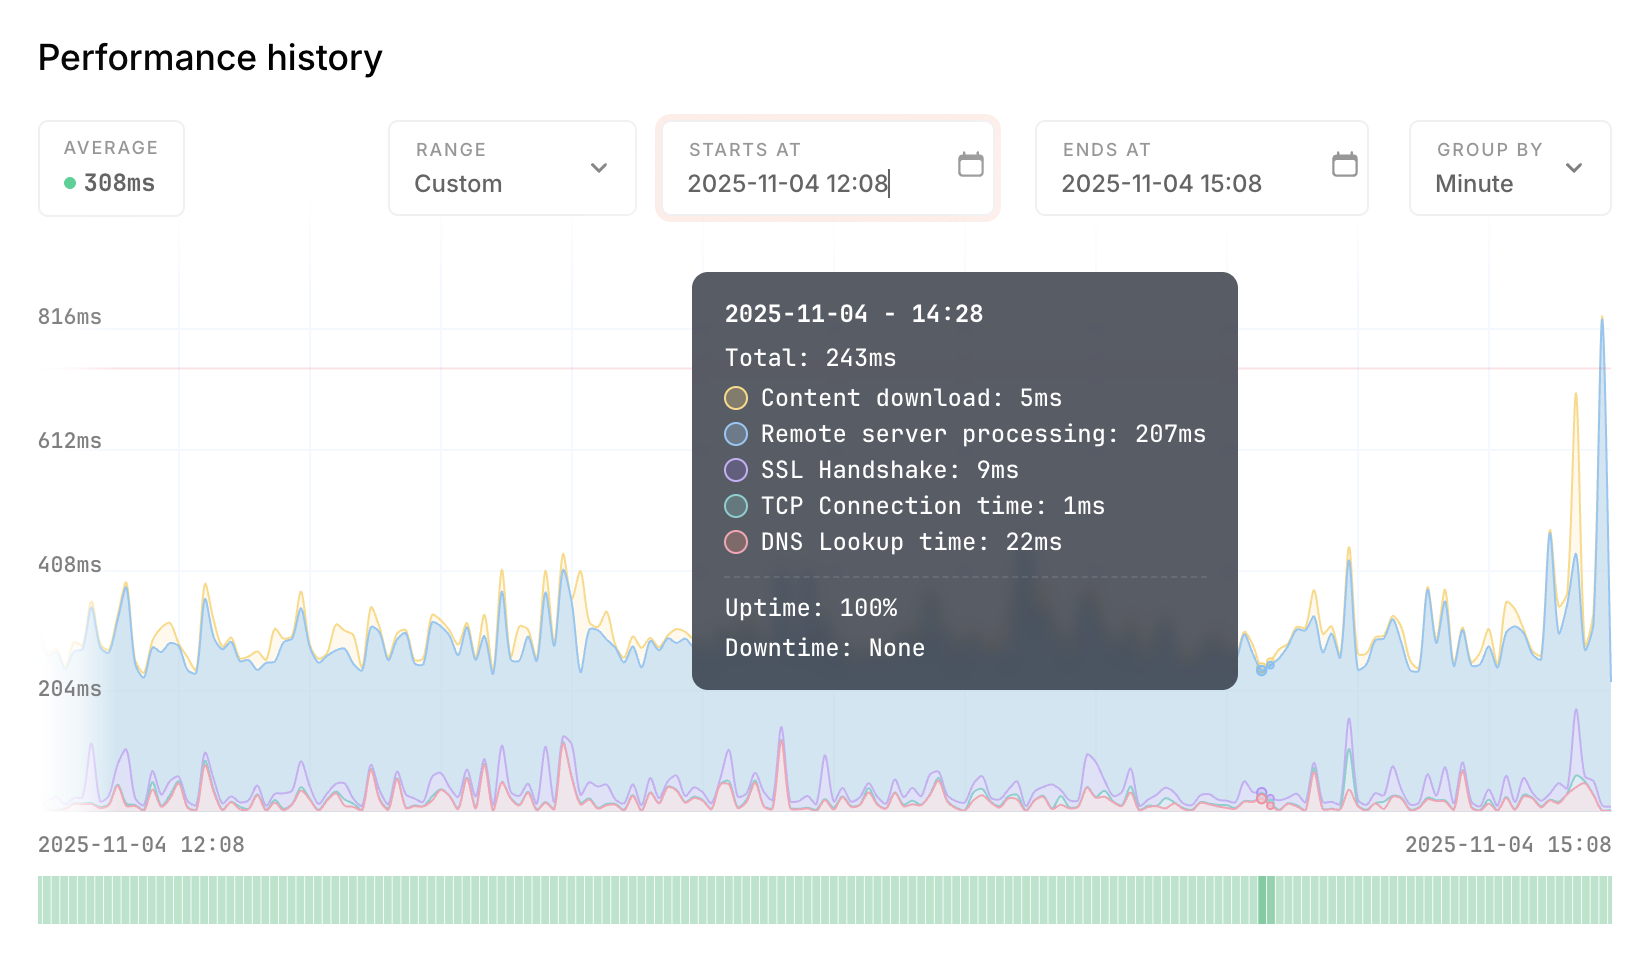
When you monitor a website at Oh Dear, the monitoring also includes the historical performance insights that belong to that monitor. It gives you a historical overview of the speed of that monitor, allowing you to see anomalies and changes over time.
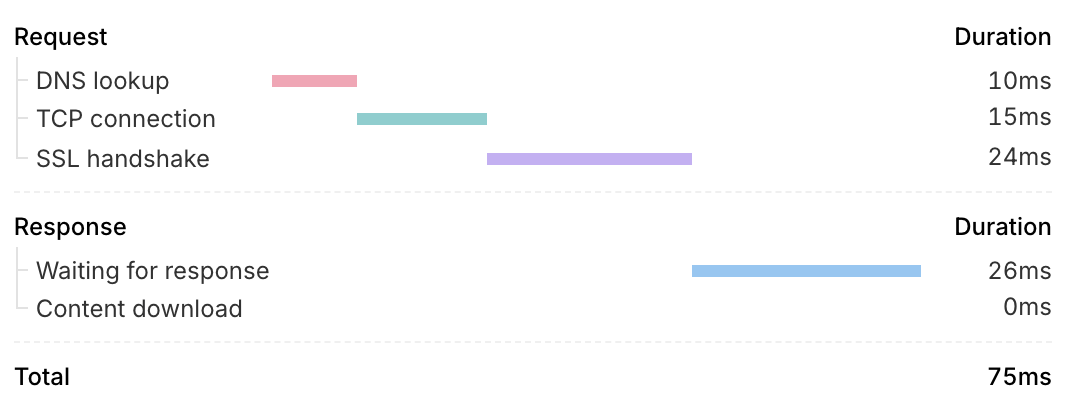
As of today, there's a second view available, one that matches the webbrowser visualisation of the timing of a single request.

This view shows the same waterfall information you'd find in Chrome or Firefox, providing a familiar view to developers worldwide.
The historical insights remain available as always, of course, allowing you to zoom out and look at the bigger picture.

You'll find the new view under the "Show all details" section of an uptime monitor.


