Every monitor added to Oh Dear will automatically be checked for uptime. Every time we check the uptime, we also collect and store detailed performance metrics for that website.
Monitor Types #
Oh Dear supports multiple types of monitoring to suit different use cases:
HTTP Monitoring #
HTTP monitoring is the most common type and is perfect for monitoring websites and web applications. We send HTTP requests to your website and check for proper responses, response times, and content verification.
Use HTTP monitoring when:
- You want to monitor a website or web application
- You need to verify specific content on a page
- You want to test custom headers or authentication
- You need detailed performance metrics (DNS lookup, connection time, etc.)
Ping (ICMP) Monitoring #
Ping monitoring uses ICMP packets to check if a server is reachable on the network level. This is ideal for monitoring servers, network devices, or services where HTTP isn't available.
Use Ping monitoring when:
- You want to monitor server availability at the network level
- You're monitoring non-web services or network devices
- You need basic connectivity checks without application-layer testing
- You want to monitor internal servers or infrastructure
TCP Port Monitoring #
TCP port monitoring checks if specific ports are open and accepting connections. This is perfect for monitoring services like databases, mail servers, or any service running on a specific port.
Use TCP port monitoring when:
- You want to monitor specific services (databases, mail servers, etc.)
- You need to check if a particular port is accessible
- You want to verify service-specific protocols with custom strings
- You're monitoring services that don't use HTTP
Multi-location monitoring #
Each monitor is checked from a primary location and verified from a secondary location. You can choose your primary location from within the Oh Dear dashboard.
If the primary location reports a problem, the secondary location immediately runs a verification check. There are three possible outcomes:
- Both locations report the monitor as down: the run is marked as failed and, after the configured number of consecutive failures, a downtime notification is sent.
- Primary fails, secondary succeeds: the run is marked as warning. This means the monitor is reachable from at least one location, so no downtime is recorded. You'll see "Partially unreachable" in your dashboard.
- Primary reports the monitor as up: the run is immediately marked as succeeded without needing a secondary verification.
The secondary location is randomly chosen. We prevent the same location from being chosen twice in a row, and prefer locations that are on the same continent as your primary location.
Warning state #
A warning occurs when the primary checker location cannot reach your monitor, but the secondary location confirms it is still online. This typically indicates a regional or network-level connectivity issue rather than your server being fully down.
Warnings count as online for uptime percentage calculations. They do not create downtime periods and will not reduce your reported uptime. No downtime notification is fired for a warning.
In the dashboard, a monitor with a warning shows "Partially unreachable" as its status. The run detail page will include results from both checker locations so you can investigate the discrepancy.
Uptime options #
To check the uptime, we'll send a simple GET request to the monitor you provide. If it responds with a 2xx HTTP response, the check passes. In the settings screen of the monitor, there are several options available to customize this check:
- look for string: we can check if a given string is found on the result. If it is not found, we'll mark the check as failed. This is sometimes called a "check string" or "HTML verification".
- absent string: we can check if a given string is not present on the result. If it is found, we'll mark the check as failed.
- response headers: you can configure the uptime check to verify the values of certain headers on the response.
- response body assertions: for endpoints that return JSON, you can assert that specific fields in the response body hold the values you expect. If any assertion fails, we'll mark the check as failed. This is covered in detail below.
- http verb: instead of a
GET request, you can specify that the check should be performed with a POST, PATCH or PUT HTTP method.
- payload: when not using a
GET request to check your website, you can specify a payload. This payload will be sent along as the form parameters when checking your website.
- request headers: you can specify up to 5 extra HTTP headers that should be used when sending an uptime request to your website.
- redirect URL: you can specify a redirect URL that should be used when checking the uptime of your website. This is useful to verify that your website redirects to a different URL when the uptime check is performed.
Cache-busting with magic variables #
A CDN like Cloudflare can keep serving a cached page even when your origin server is down. From the outside everything looks fine, but you'd never know your application is broken.
To work around this, you can use magic variables anywhere in your monitor URL, in your custom request headers, or in your POST payload. Right before each check, we replace them with fresh values, so every request is unique enough to bypass the cache.
The following variables are available:
$OH_DEAR_TIMESTAMP: the current UTC date and time with millisecond precision in YmdHisv format, e.g. 20260516112100123 (2026-05-16 11:21:00.123 UTC). Compact, sortable, URL-safe, and great as a cache-buster query string.$OH_DEAR_ISO8601: the current UTC time in ISO 8601 format, e.g. 2026-05-16T11:21:00Z. Useful for signed URLs and Date headers.$OH_DEAR_UUID: a fresh v4 UUID, e.g. fd5735c5-134a-4e3c-a425-1b0794103df0. Handy for idempotency keys and webhook replay protection.$OH_DEAR_RANDOM: a random 8-character alphanumeric string, e.g. aB3xY7kQ. A lightweight cache-buster when you want something in a path segment instead of a query string.
For example, a monitor URL like this:
https://your-site.com/?cb=$OH_DEAR_TIMESTAMP
Becomes something like this when we actually check it:
https://your-site.com/?cb=20260516112100123
Within a single check, the same variable always expands to the same value. If you put $OH_DEAR_UUID in both the URL and an X-Request-ID header, they'll match, so you can correlate the request on your side.
The expanded URL is shown on the uptime check report page, so you can see exactly what we requested for each run.
Ping (ICMP) Monitoring Options #
For ping monitoring, you can configure these settings:
- Ping count: The number of ping packets to send each time we check its uptime.
- Interval between pings: The time to wait between individual ping packets when sending multiple pings.
- Timeout: How long to wait for a ping response before timing out.
- Packet size: The size of each ping packet in bytes.
- Maximum number of hops: The maximum number of hops a packet can make before being discarded.
- Acceptable packet loss: The maximum percentage of packet loss before marking the site as down.
- Acceptable average response time: The maximum average response time in milliseconds before marking the site as down.
TCP Port Monitoring Options #
For TCP port monitoring, you can configure several specific settings:
- Timeout: The maximum time to wait for the TCP connection and response in milliseconds (default: 1000ms).
- Look for string in welcome message: An optional string to look for in the server's initial response. If specified and not found, the check will fail. This is useful for verifying specific services (e.g., "220 smtp.gmail.com ESMTP" for SMTP servers).
- Send string: An optional string to send after establishing the TCP connection. You can use \r and \n for line breaks (e.g., "EHLO example.com\r\n" for SMTP).
- Look for string in send string response: An optional string to look for in the server's response to the send string. If specified and not found, the check will fail (e.g., "250-smtp.gmail.com" for SMTP responses).
When we make a request to your website to verify that it's up, the response of your server will contain certain headers. We can verify that those headers contain the values you expect. If these expectations are not met, we'll consider your website as down.
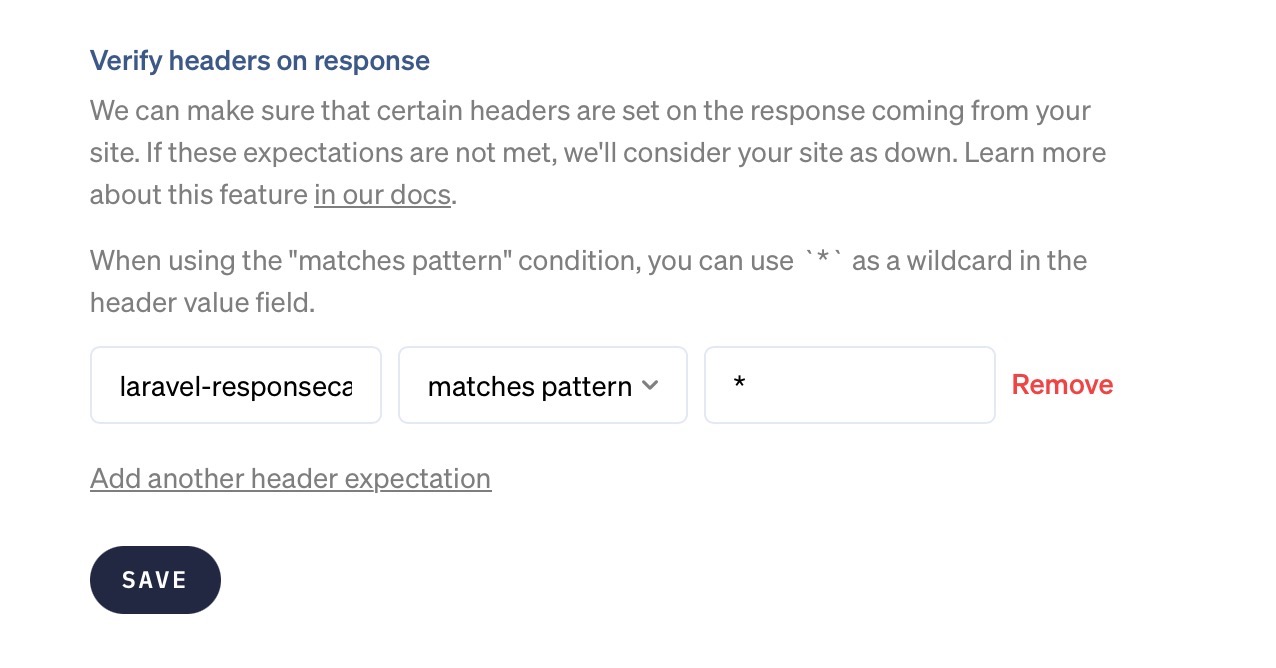
In the "Responses" section of the uptime settings page, you can specify which headers we should verify.
You could add this expectation to ensure your page uses gzip compression.

If you want to verify that a particular header is set on the response, regardless of its value, you can use the "matches pattern" condition and the * wildcard as the value. In this example, we'll verify that the response contains a header named laravel-responsecache with any value.
To assert that a header is absent, use the "not exists" condition. It needs no value and is handy for catching headers that shouldn't leak, like X-Powered-By or Server.
The "not contains" condition passes when the header is absent: a header that isn't there can't contain the value you're guarding against. This lets you watch for an accidental noindex in X-Robots-Tag without failing the check on pages that don't send the header at all.
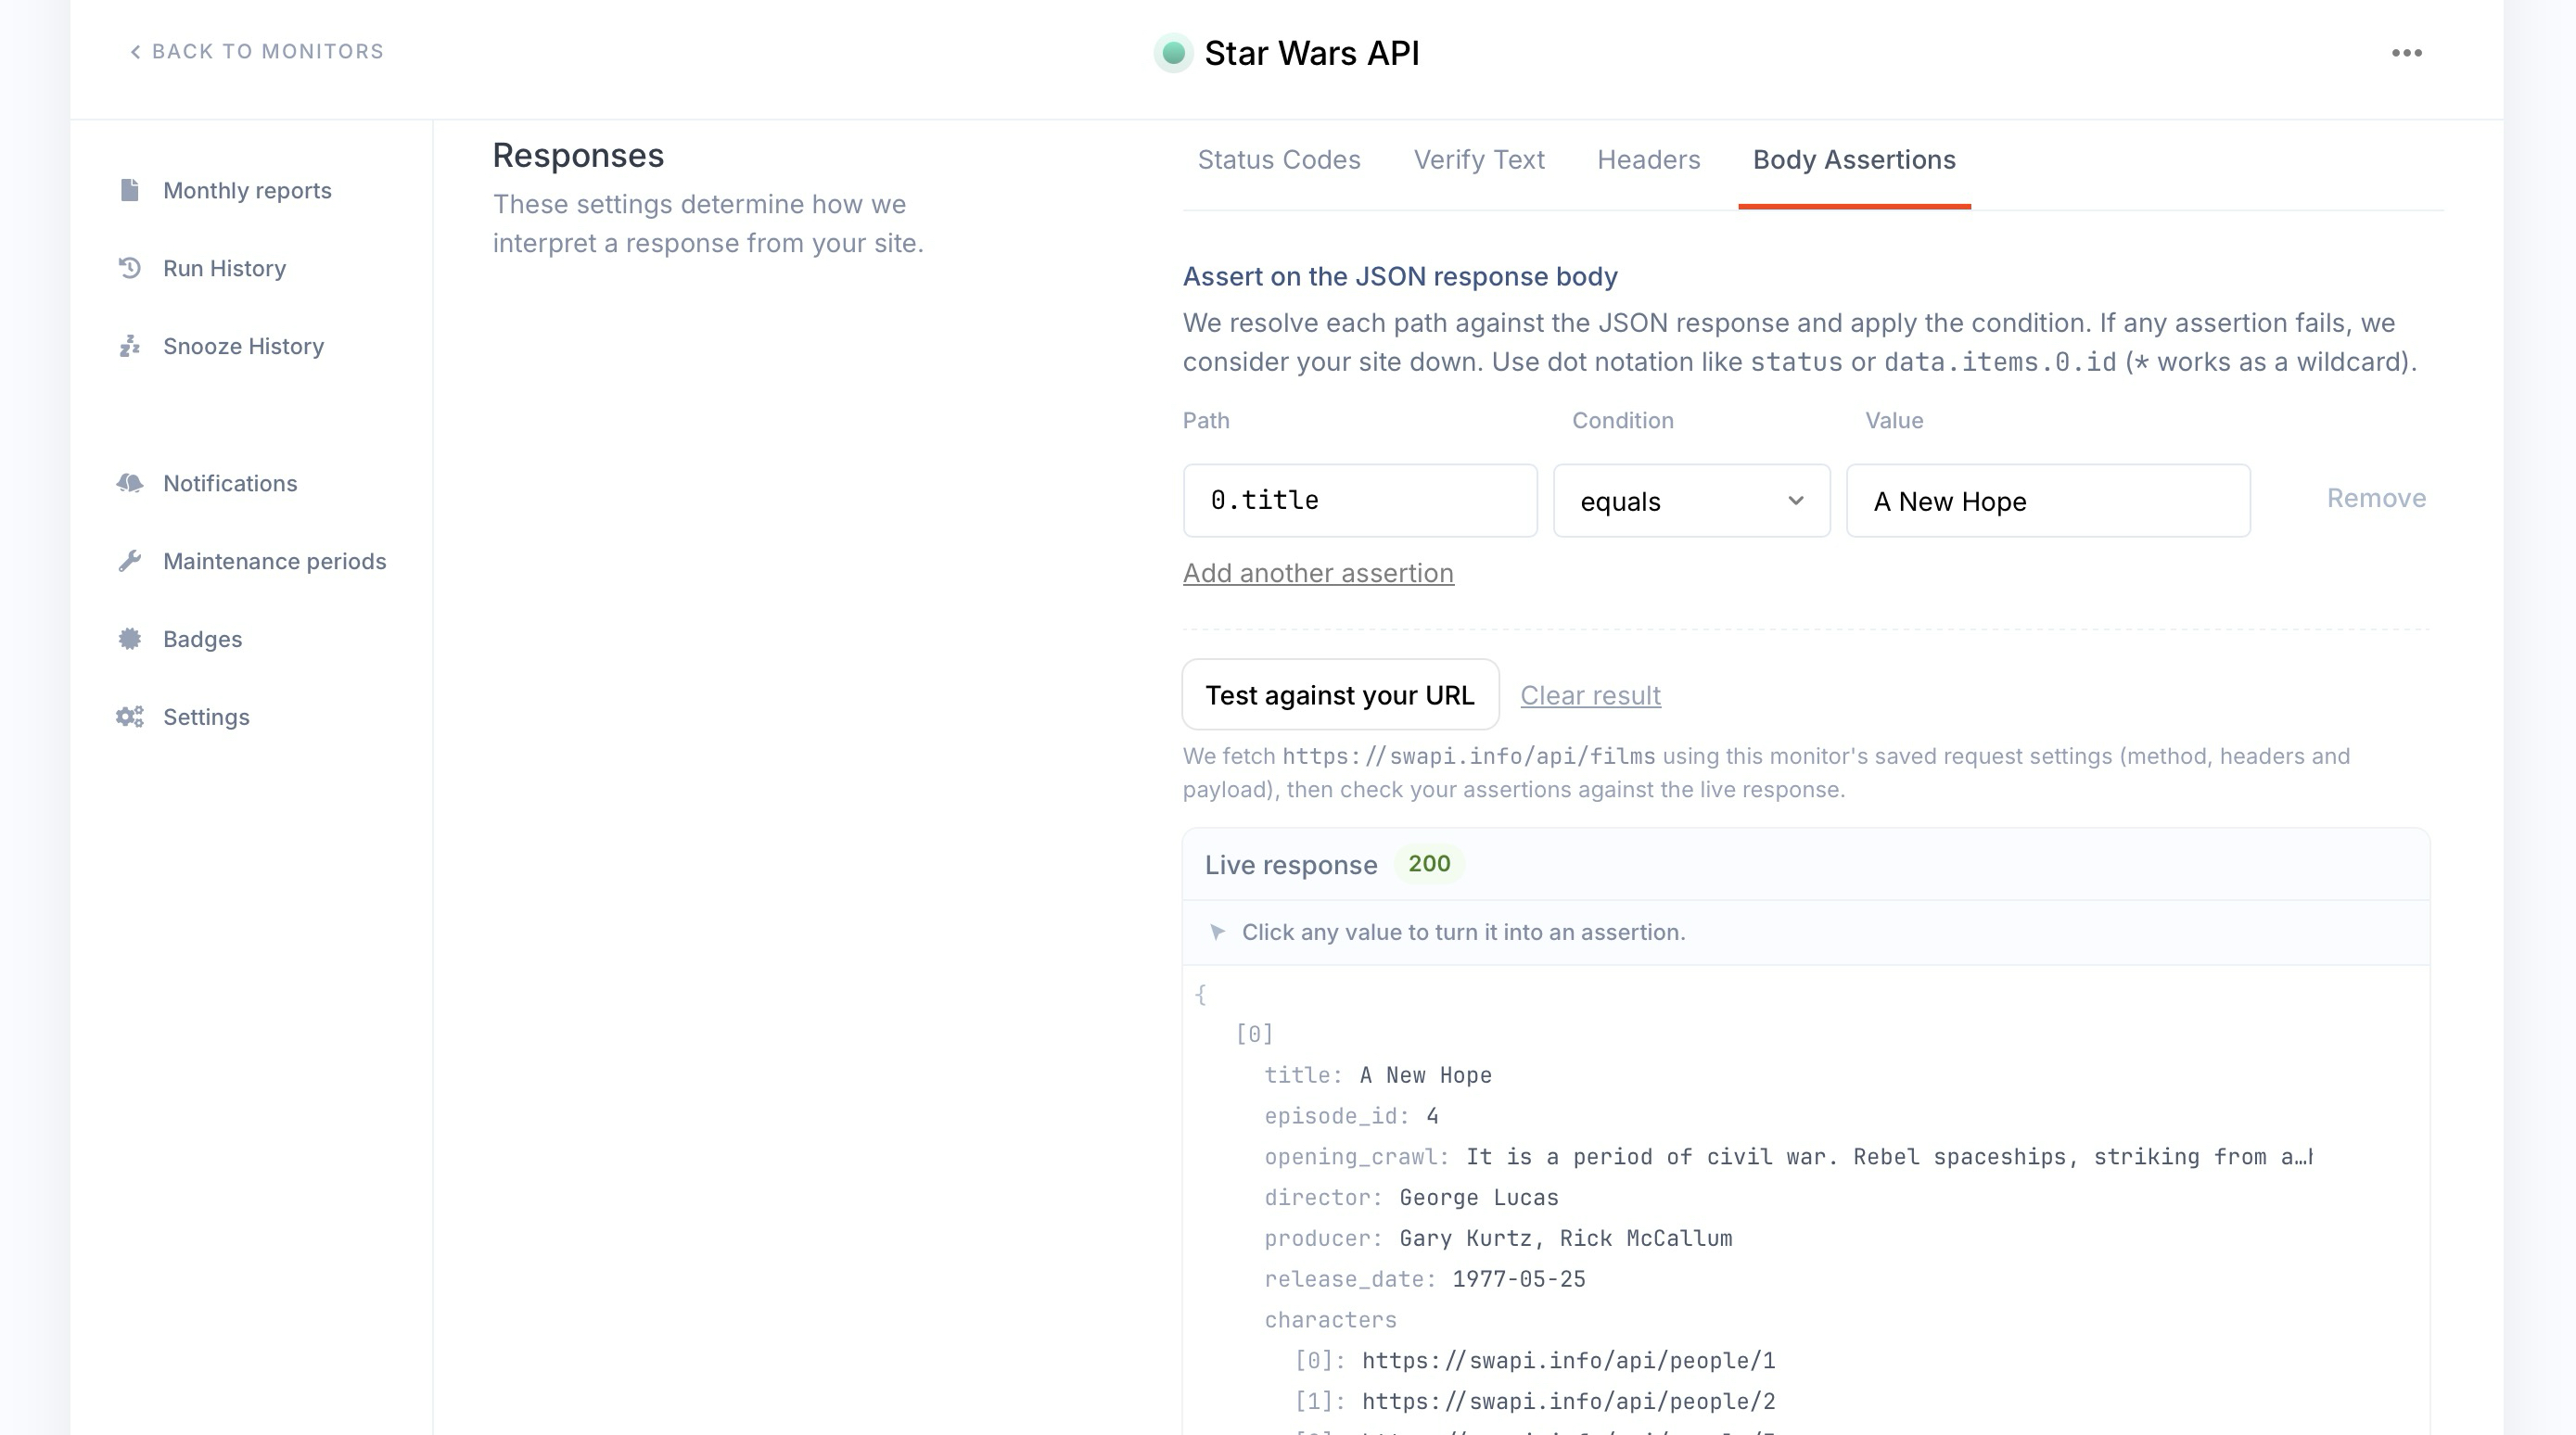
Asserting on the JSON response body (HTTP monitoring only) #
A 200 OK only tells you that your server answered. It doesn't tell you the answer was correct. For endpoints that return JSON, you can go a step further and check the actual values in the response body. If any assertion fails, we'll consider your monitor down, the same way we would for a timeout or a 500.
You'll find this in the "Responses" section of the uptime settings, under the "Body Assertions" tab. Each assertion has three parts:
- path: which field to read, written in dot notation.
- condition: how we should compare it.
- value: what you expect (not needed for
exists and does not exist).
Paths #
Paths use dot notation to walk into the JSON, the same way you would in most programming languages. Array items are addressed by their index, and a * wildcard spreads across every item in a list.
Given this response:
{
    "status": "ok",
    "items": [
        { "id": 1, "name": "first" },
        { "id": 2, "name": "second" }
    ]
}
These paths resolve as follows.
| Path |
Resolves to |
status |
ok |
items.0.id |
1 |
items.0.name |
first |
items.*.id |
every item id (1 and 2) |
Conditions #
| Condition |
Passes when the value |
| equals |
matches exactly |
| not equals |
is anything else |
| contains |
holds the given substring, or (for a list) contains the given item |
| greater than |
is a number greater than yours |
| less than |
is a number less than yours |
| exists |
is present at the path |
| does not exist |
is absent from the path |
You can add several assertions to a single monitor. If any one of them fails, the monitor is marked down.
Test against your URL #
You don't have to save and wait to find out whether your paths are right. On the Body Assertions tab, hit "Test against your URL" and we'll fetch your endpoint with the request settings you've already configured (method, headers, payload), then run your assertions against the live response right there in the form, as shown in the screenshot above. You can even click any value in that response to turn it straight into an assertion.
We only evaluate assertions when the response is valid JSON. If the body is empty, isn't valid JSON, or is larger than 2 MB, we can't evaluate it and the check fails with a message that says so.
Check frequency #
Uptime checks happen every minute from the primary location.
As soon as the primary location detects a problem, the secondary location will be used to verify it.
If you were to put this on a timeline, it would look like this.
| Time |
Status |
Monitored via |
| 15:20h |
OK |
Primary location |
| 15:21h |
OK |
Primary location |
| 15:22h |
PROBLEM |
Primary location |
| 15:22h |
WARNING |
+ Secondary location (up) = partial connectivity |
| 15:23h |
PROBLEM |
Primary location |
| 15:23h |
PROBLEM |
+ Secondary location (down) |
| 15:24h |
PROBLEM |
Primary location |
| 15:24h |
PROBLEM |
+ Secondary location (down) |
| 15:24h |
|
Notification fired: monitor DOWN |
| 15:25h |
PROBLEM |
Primary location |
| 15:25h |
PROBLEM |
+ Secondary location (down) |
| 15:26h |
OK |
Primary location |
| 15:26h |
|
Notification fired: monitor UP |
| 15:27h |
OK |
Primary location |
| 15:28h |
OK |
Primary location |
The first problem is detected at 15:22h and the secondary location immediately verifies. At 15:22h the secondary location reports the monitor as up, so the run is marked as WARNING (partial connectivity). No downtime notification is fired because the monitor is still reachable from one location.
At 15:23h both locations confirm the problem, this is the first confirmed-down minute. At 15:24h both locations confirm the problem again, giving us 2 consecutive minutes of confirmed downtime, so the notification fires. If this is too quick you can increase the number of downtime minutes before a notification in 'Monitors > Settings > Uptime > Notification settings'.
The check at 15:26h confirmed the monitor was back online, so you'll be notified of that too.
Note: choose when you are alerted
You can overwrite the behaviour for
when we alert you, by changing the
monitor settings in your dashboard.
What is downtime? #
We classify downtime in three ways:
- If we receive anything other than an
HTTP/2xx response code on the check page, we consider it down. Note that we will follow HTTP redirects (301, 302, 307, 308, etc.). The final result of the redirect should be an HTTP/2xx.
- If we receive a
HTTP/2xx response, but we didn't find the optional check string specified on the monitor settings screen, we consider it down.
- If we receive a
HTTP/2xx response, but one of your response body assertions didn't pass, we consider it down.
- If the website takes more than 5 seconds to load, we consider it down.
Any of those events marks the monitor as unavailable, but only when both the primary and secondary checker locations confirm the problem. If the primary location reports a failure but the secondary location reaches your monitor successfully, the run is marked as a warning instead. Warnings do not count as downtime and will not affect your uptime percentage.
For example, an HTTP/204 No Content response will also be considered "online".
Detailed reporting #
If the monitor took too long to load, we can only show you that it timed out.
Operation timed out after 5000 milliseconds with 0 bytes received
However, if the website responded with a status code other than HTTP/2xx, we will show you the exact HTTP response headers we received to help you troubleshoot, along with the IP(s) we used to monitor your site.
Downtime is verified from multiple locations, those locations and their IP addresses are confirmed in the notification:
Monitored from: Paris, France (45.32.146.84, 2001:19f0:6801:5f3:5400:1ff:fe38:3572)
Verified downtime via: Frankfurt, Germany (165.22.95.234, 2a03:b0c0:3:e0::220:2001)
All debug-headers are supplied for you, together with copy/paste cURL commands for you to replicate our exact check.
$ curl -i https://yoursite.tld
HTTP/1.1 500 Internal Server Error
Date: Sun, 03 Dec 2017 16:05:11 GMT
Content-Type: text/html; charset=UTF-8
Transfer-Encoding: chunked
Connection: keep-alive
Set-Cookie: ...
With that information, you should have all the information to troubleshoot the problem.
You can configure two kinds of alerts regarding performance.
- Hard threshold: if the monitor is continuously slower than this value, we will alert you
- Performance changes: if a website is suddenly this % faster or slower, we will alert you
They both serve their own purpose and will keep you informed on the overall health of your website.
We look at the difference between the average response time in the past two hours vs average response time in past 15 minutes. Any change faster or slower than the Website performance change notification percentage defined in your website performance settings (e.g. 50%) will trigger an alert.
Your Website performance threshold is your maximum allowable website speed (in milliseconds) before your website is considered slow and alert is sent.
We will be able to show you the following detailed metrics.
- DNS lookup: The time it takes to resolve the domain name to an IP address via DNS.
- TCP Connection Time: The time it takes to connect to the remote host (TCP three-way handshake).
- TLS Connection Time: The total time it took for the TLS handshake to complete (cipher negotiation & encryption).
- Remote Server Processing: The time it took the server to process the request and start sending the first byte of the page.
- Content Download: The time it took for the page to be downloaded.
The Time To First Byte (or TTFB) is the same as our Remote Server Processing time.
Monthly reporting #
Each month, you'll receive an uptime report for all your monitors to show you how well they performed.
In it, we show you what percentage of uptime each website received, as monitored via its primary location. If a website is down, it'll be subtracted from the total uptime.
Here's what that might look like.
| Website |
Uptime |
| ohdear.app |
100% |
| ourcompetitor.io |
99.95% |
| hackerne.ws |
100% |
Want to know what happened during that month? Click through each monitor and navigate to the uptime page in the Oh Dear dashboard to see the timings of each downtime.
You can add custom headers through your monitor settings. This is a great way to monitor websites behind basic authentication.
Here's an example of adding custom headers for such a setup: https://ohdear.app/news-and-updates/how-to-monitor-websites-behind-http-basic-authentication
Monitoring uptime of authenticated pages #
Yes, you can add custom headers to authenticate Oh Dear to your application through your monitor settings.
Here's an example of adding custom headers for such a setup: https://ohdear.app/news-and-updates/how-to-monitor-websites-behind-http-basic-authentication
Our monitoring locations #
We perform uptime checks from these locations:
Africa #
Asia #
- Bangalore
- Seoul
- Singapore
- Tokyo
Australia #
Canada #
Europe #
- Frankfurt
- London
- Paris
- Stockholm
South America #
US East #
US Central #
US West #
- Los Angeles
- San Francisco