- Bitmovin
- HBO Nordic
- Obsidian
- Laravel
- Fathom Analytics
- PHP 8
- Stanford University
- Takeaway.com
- IGN
- VRT NWS
- spatie
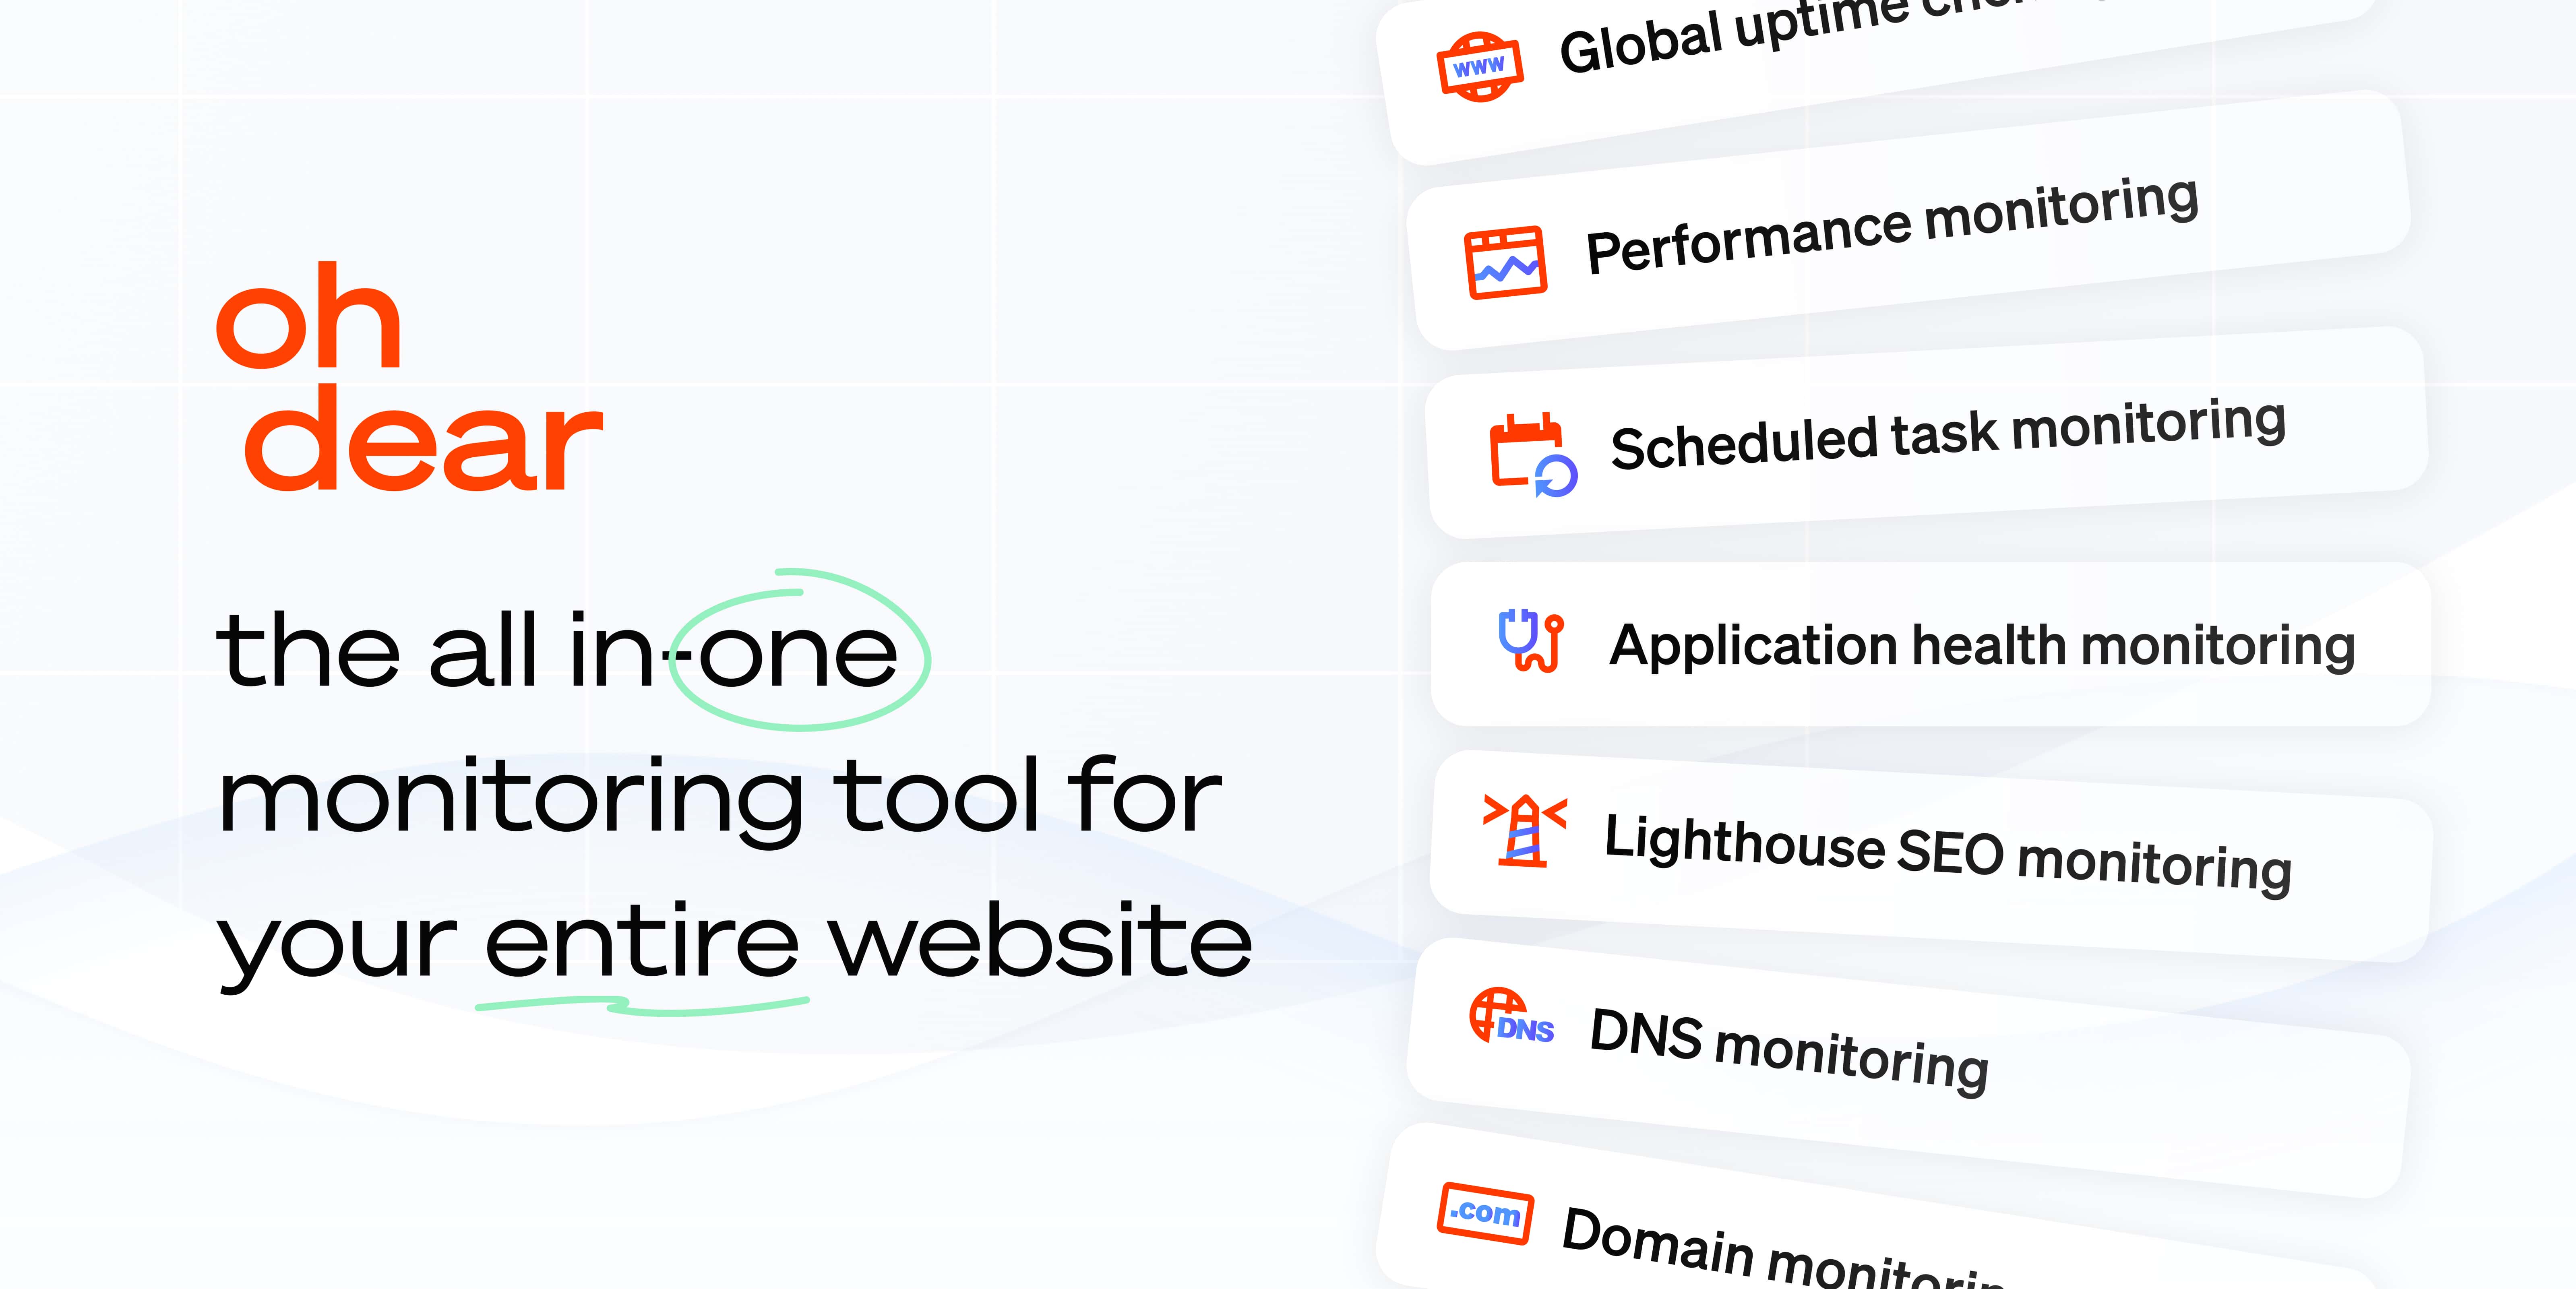
Everything self-hosted monitors make you build
1. Hosted, zero maintenance
We run the servers, probes, upgrades and global checking locations. There is nothing to install, patch, scale or babysit.
2. All-in-one, nothing to bolt on
Uptime, SSL, DNS, full-site crawl, Lighthouse, cron and status pages, built in. No plugins, exporters or extra services to wire together.
3. Checks self-hosted tools lack
Natural-language AI checks, whole-site broken-link and mixed-content crawling, real Lighthouse audits and domain expiry, none of them available out of the box in self-hosted monitors.
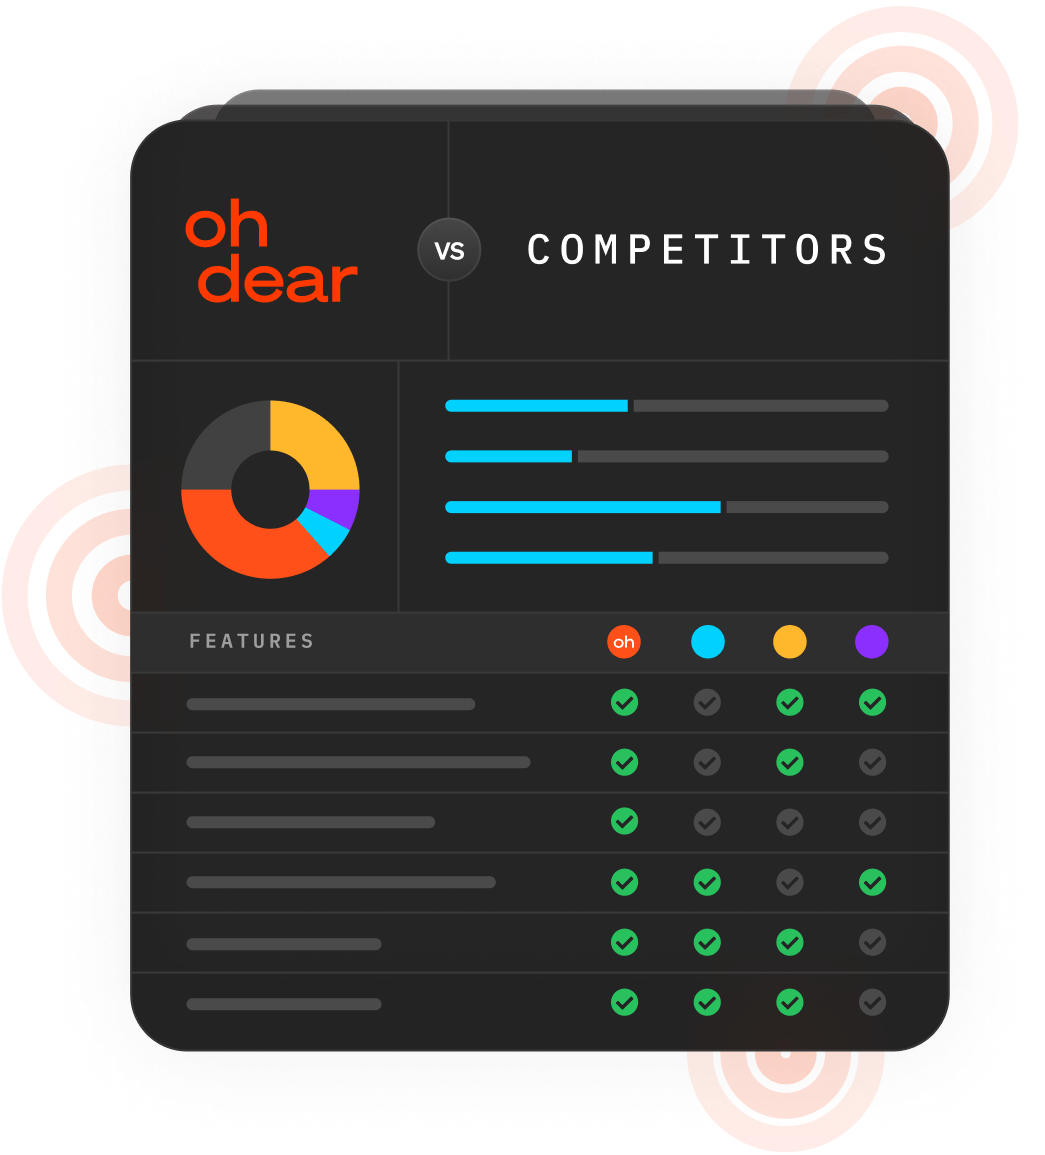
Oh Dear compared with open-source monitoring
One table. Honest, where a self-hosted tool genuinely fits better, we say so.
| oh dear | Uptime Kuma | Zabbix | Nagios | Icinga | Prometheus | Checkmk | |
|---|---|---|---|---|---|---|---|
| Uptime monitoring? | Yes | Yes | Yes | Yes | Yes | Yes | Yes |
| Ping monitoring? | Yes | Yes | Yes | Yes | Yes | Yes | Yes |
| TCP port monitoring? | Yes | Yes | Yes | Yes | Yes | Yes | Yes |
| Performance monitoring? | Yes | Partial | Yes | Partial | Partial | Partial | Yes |
| Lighthouse audits? | Yes | No | No | No | No | No | No |
| Certificate health (SSL/TLS)? | Yes | Yes | Yes | Yes | Yes | Partial | Yes |
| Broken links & mixed content? | Yes | No | No | Partial | No | No | No |
| Sitemap monitoring? | Yes | No | No | Partial | No | No | No |
| DNS monitoring? | Yes | Yes | Yes | Yes | Yes | Yes | Yes |
| DNS blocklist monitoring? | Yes | No | Partial | Partial | Partial | No | No |
| Domain expiry monitoring? | Yes | Yes | Partial | Partial | Partial | No | Partial |
| Scheduled-task / cron? | Yes | Yes | Partial | Partial | Partial | Partial | Partial |
| Application health checks? | Yes | Partial | Yes | Partial | Partial | Partial | Partial |
| Port scanner? | Yes | No | Partial | Partial | Partial | No | No |
| AI-powered checks? | Yes | No | No | No | No | No | No |
| Notifications & integrations? | Yes | Yes | Yes | Yes | Partial | Yes | Yes |
| Status pages? | Yes | Yes | Partial | No | No | No | No |
| Automated client reports? | Yes | No | Partial | Partial | Partial | No | No |
| Custom branding (logo & colours)? | Yes | Partial | Partial | Partial | Partial | No | Partial |
| Scoped client access? | Yes | No | Partial | Partial | Partial | Partial | Partial |
| Single sign-on (SSO)? | Yes | No | Yes | No | Partial | No | No |
| Hosted & managed for you? | Yes | No | No | No | No | No | No |
| Zero setup & maintenance? | Yes | No | No | No | No | No | No |
| All-in-one, nothing to bolt on? | Yes | Partial | No | No | No | No | No |
| Entry price? | €15 | Free | Free | Free | Free | Free | Free |
Sourced from each vendor's docs · June 2026
When self-hosting is the better call
If you have the team and the time, open-source can be the right answer. Here's when.
Free & self-hosted
Best if you want open-source and do not mind hosting and maintaining it yourself: fast intervals, but no on-call or full-site crawl.
Deep infrastructure monitoring
Best if you need powerful, highly-customisable infrastructure, network and server monitoring and have the team to deploy, template and maintain it.
Battle-tested & plugin-driven
Best if you want the long-established standard with a huge plugin catalogue and are comfortable wiring it up and maintaining it via config files.
Modern Nagios-compatible core
Best if you want Nagios plugin compatibility with a more modern engine and web interface, and have the team to run it.
Metrics-first observability stack
Best if you are standardising on Prometheus for metrics and alerting and will assemble Blackbox Exporter, Alertmanager and Grafana for uptime probes yourself.
Batteries-included self-hosted
Best if you want a self-hosted monitor with many built-in checks out of the box and accept that SSO and scale features are commercial-only.
And we mean it. We run Zabbix ourselves to keep an eye on Oh Dear's own infrastructure, so we know first-hand how powerful it is. That power just comes with the knowledge to set it up and the upkeep to keep it running. If that's not where you want your team spending its time, that's exactly where we come in.
One tool instead of five
Every monitoring tool started by answering one question: is the site up? Then the questions kept coming. Is the SSL certificate about to expire? Did a DNS change break email? Did last night's deploy leave forty broken links? Did the nightly backup cron actually run? Is the homepage still fast?
Most tools answer one of those and sell you an integration for the rest, or leave you running a second, third and fourth subscription. You become the integration layer, stitching alerts from five dashboards.
Oh Dear watches your whole website from one place, so the thing that breaks at 2am is something you already had a check for.
That's what the table really shows. It isn't that the others can't check uptime, everyone checks uptime. It's that everything around uptime is where sites actually break, and that's the part we refused to make you assemble yourself.
Compare Oh Dear head-to-head
Pick the open-source tool you're actually weighing us against.
Don't take our word for it
We built an incredibly powerful website monitor we know you'll love. Don't just take our word for it, here's what our users think:
Decent monitoring service!

Oh Dear allows us to always stay a step ahead of our customers regarding the performance and uptime of the website we develop. This builds trust that their application is in save hands with us.

DevOps is already a full-time job, and having Oh Dear monitor SSL is just one less thing to worry about. It's fast, detailed and easy to use.

Easy to use, all-you-need solution for website monitoring.

Oh Dear does what it needs to do in a user-friendly way.

Started using 2 years ago as a simple monitoring tools. Has become a daily must-have for uptime, performance and page speed metrics audit.

Oh Dear fairly and confidently monitors all our critical systems.

Full-featured site monitoring for a reasonable price.

Painless feature-rich website monitoring

Frequently asked questions


Isn't open-source monitoring free?
Can't I just self-host and get the same thing?
What about Uptime Kuma?
Do I lose control by going hosted?
Start monitoring instantly
Start a no-strings-attached 10-day free trial. You're all set in less than a minute. (No credit card needed.)
Not convinced yet? Need help? Get in touch via support@ohdear.app.