Infrastructure Monitoring for DevOps & Sysadmins
Monitor the infrastructure your apps depend on. TCP ports, ICMP ping, DNS records, SSL certificates, and uptime from outside your network, with alerts that route to whoever's on call.
No agents to install. No dashboards to babysit. Just reliable monitoring that fits your existing workflow.
10 day free trial
No credit card required
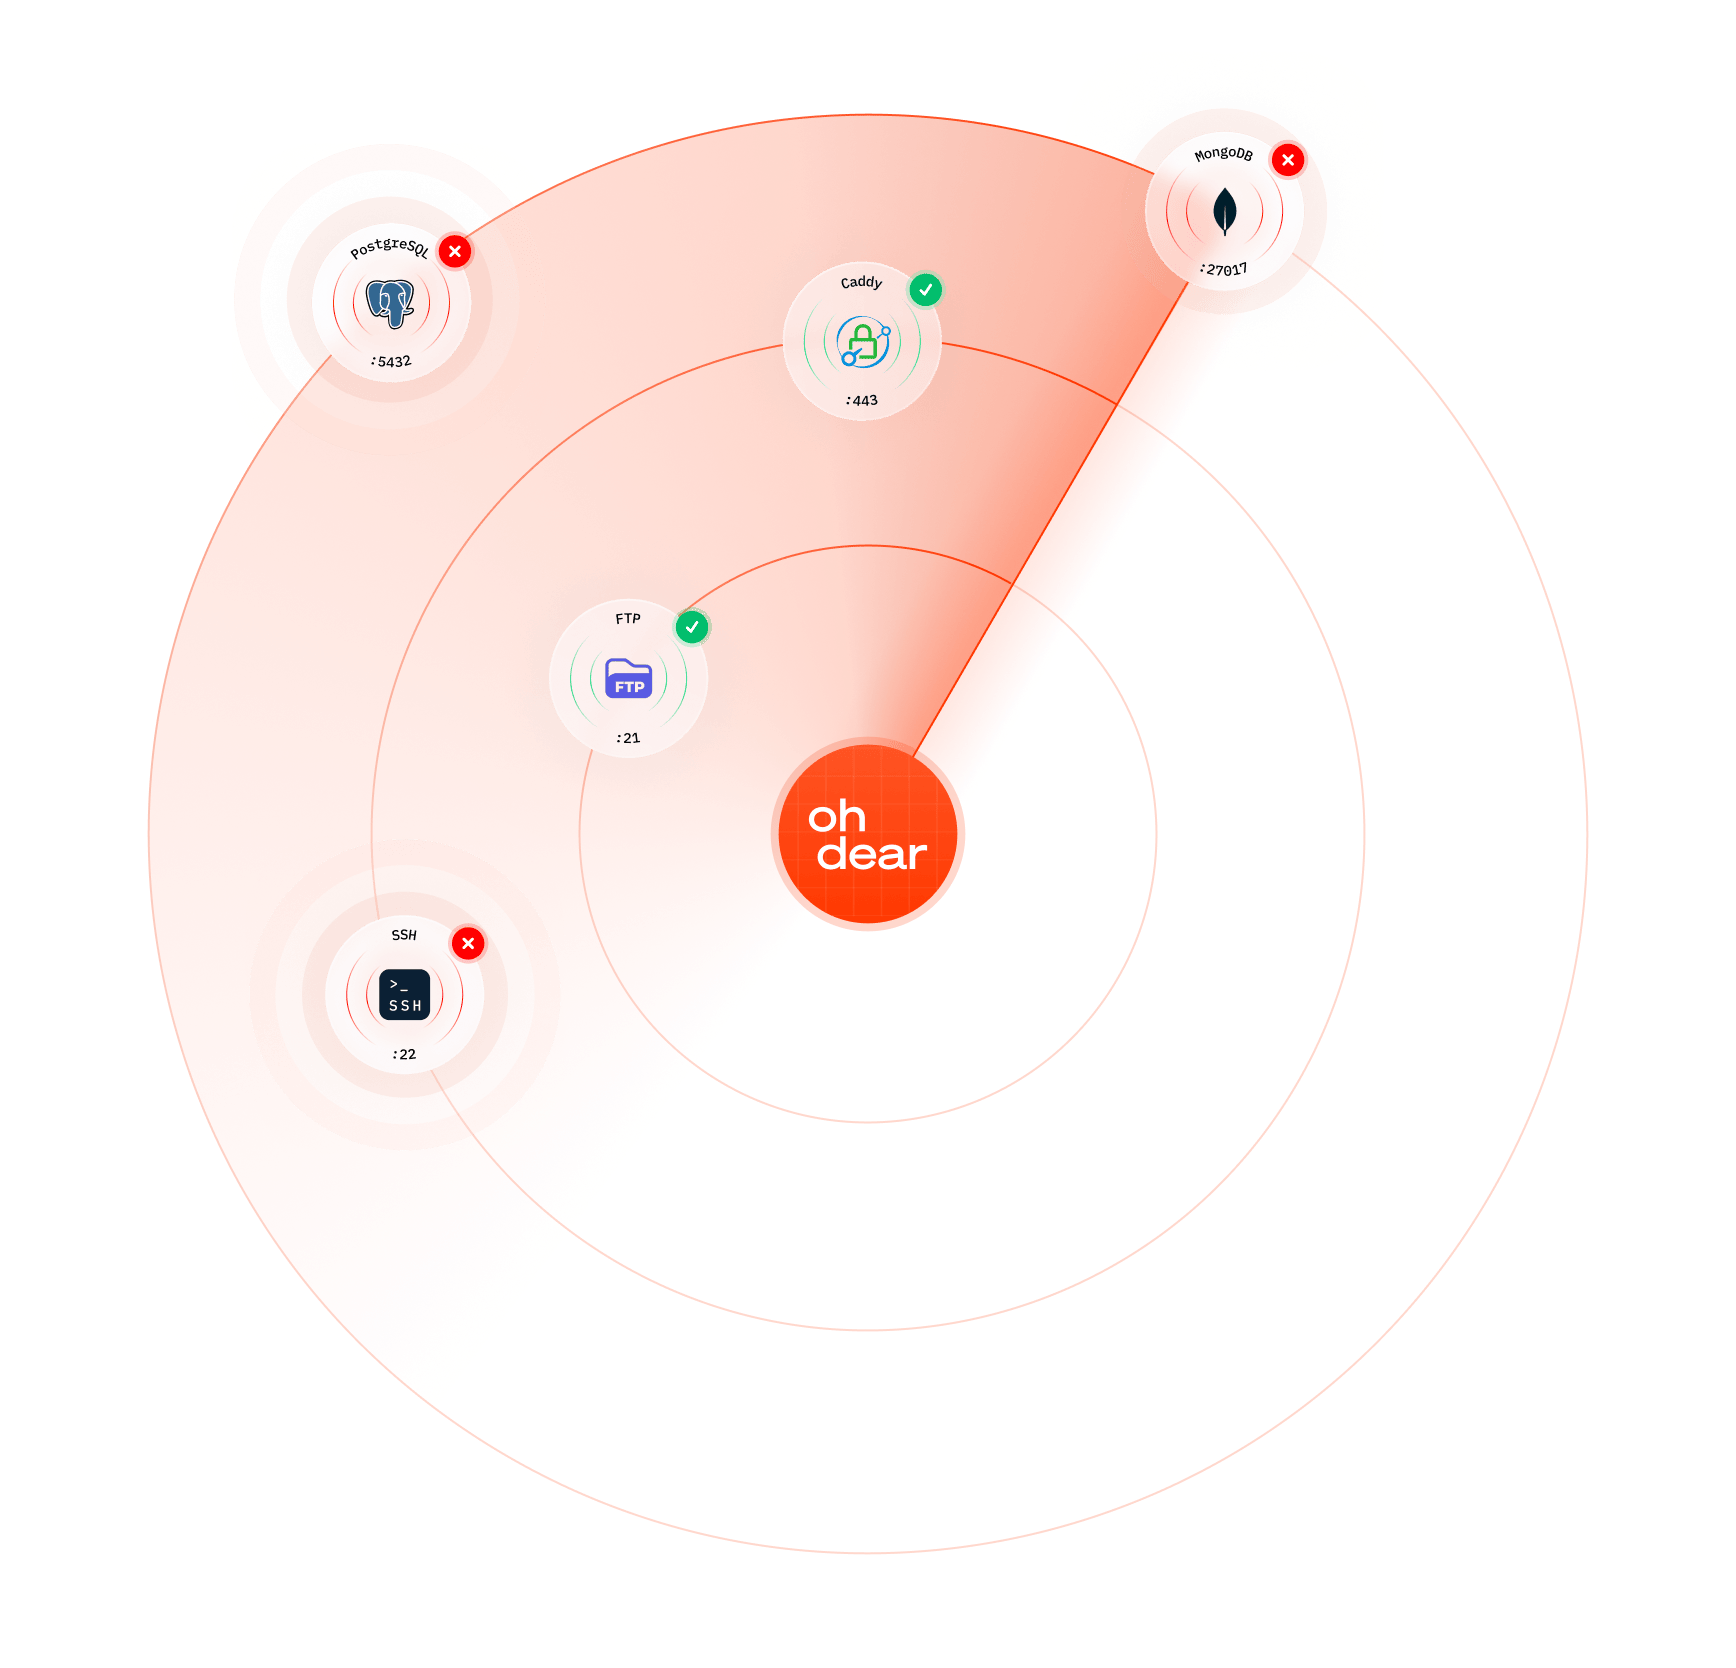
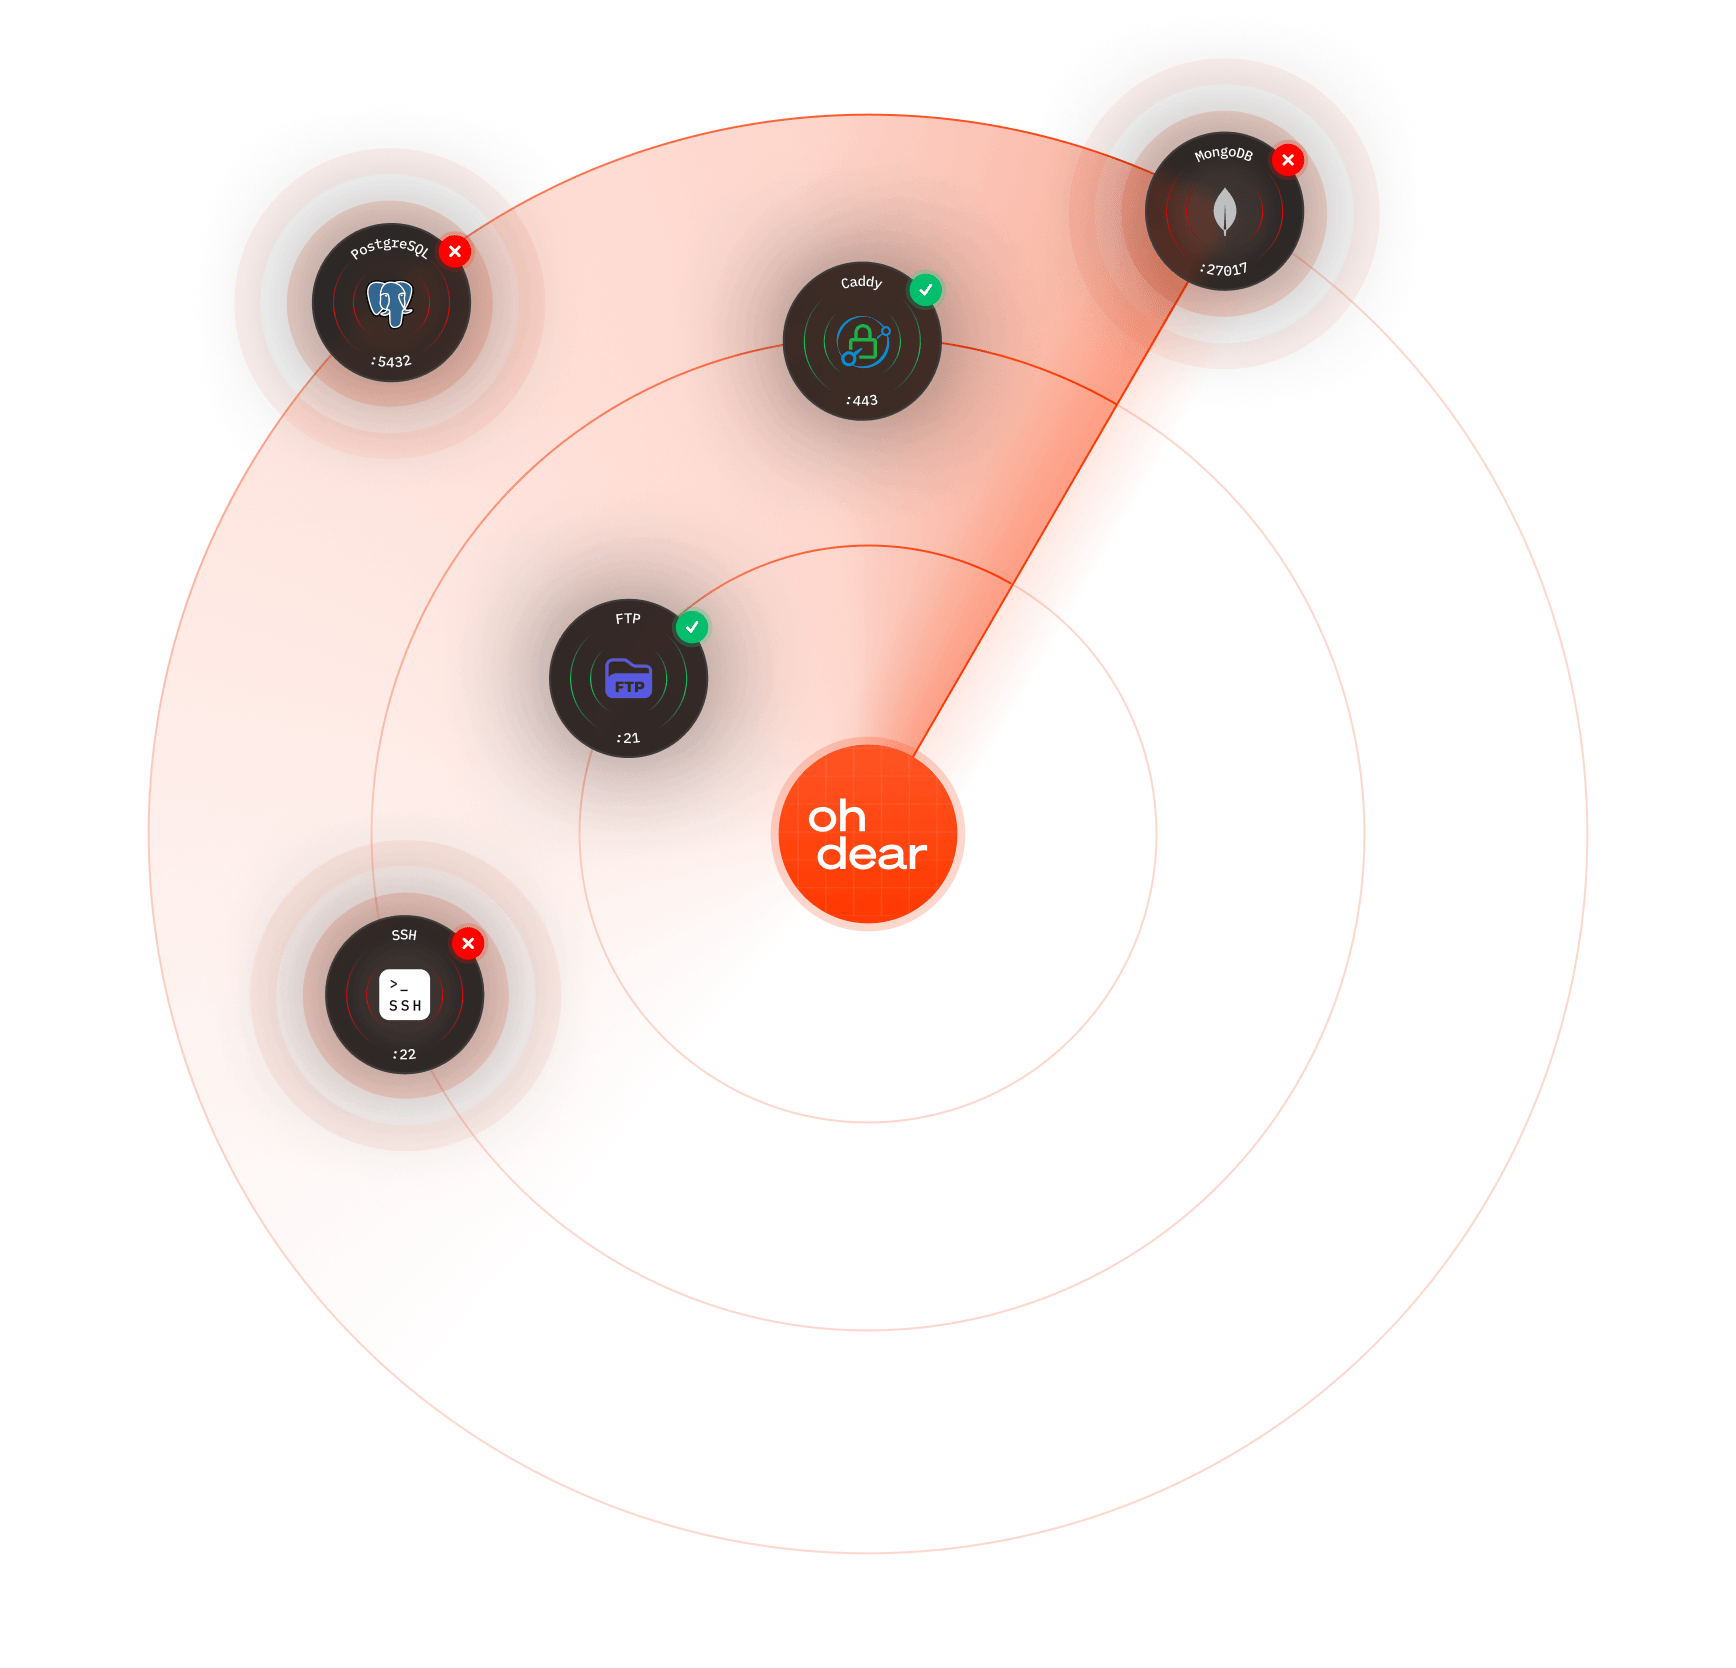
TCP port monitoring
Monitor any TCP service your infrastructure relies on. When MySQL on 3306 stops accepting connections or Redis on 6379 goes silent, you get alerted before cascading failures hit your apps.
Monitor databases, cache servers, queue workers, SMTP servers, and any other TCP endpoint that matters.
 db-primary.internal
 redis-01.internal
 mail.company.com
ICMP ping monitoring
Not everything runs a web server. Use ICMP ping to monitor network devices, internal servers, and infrastructure components that need to be reachable but don't expose HTTP.
Get latency metrics and availability data for your entire infrastructure, not just your web-facing services.
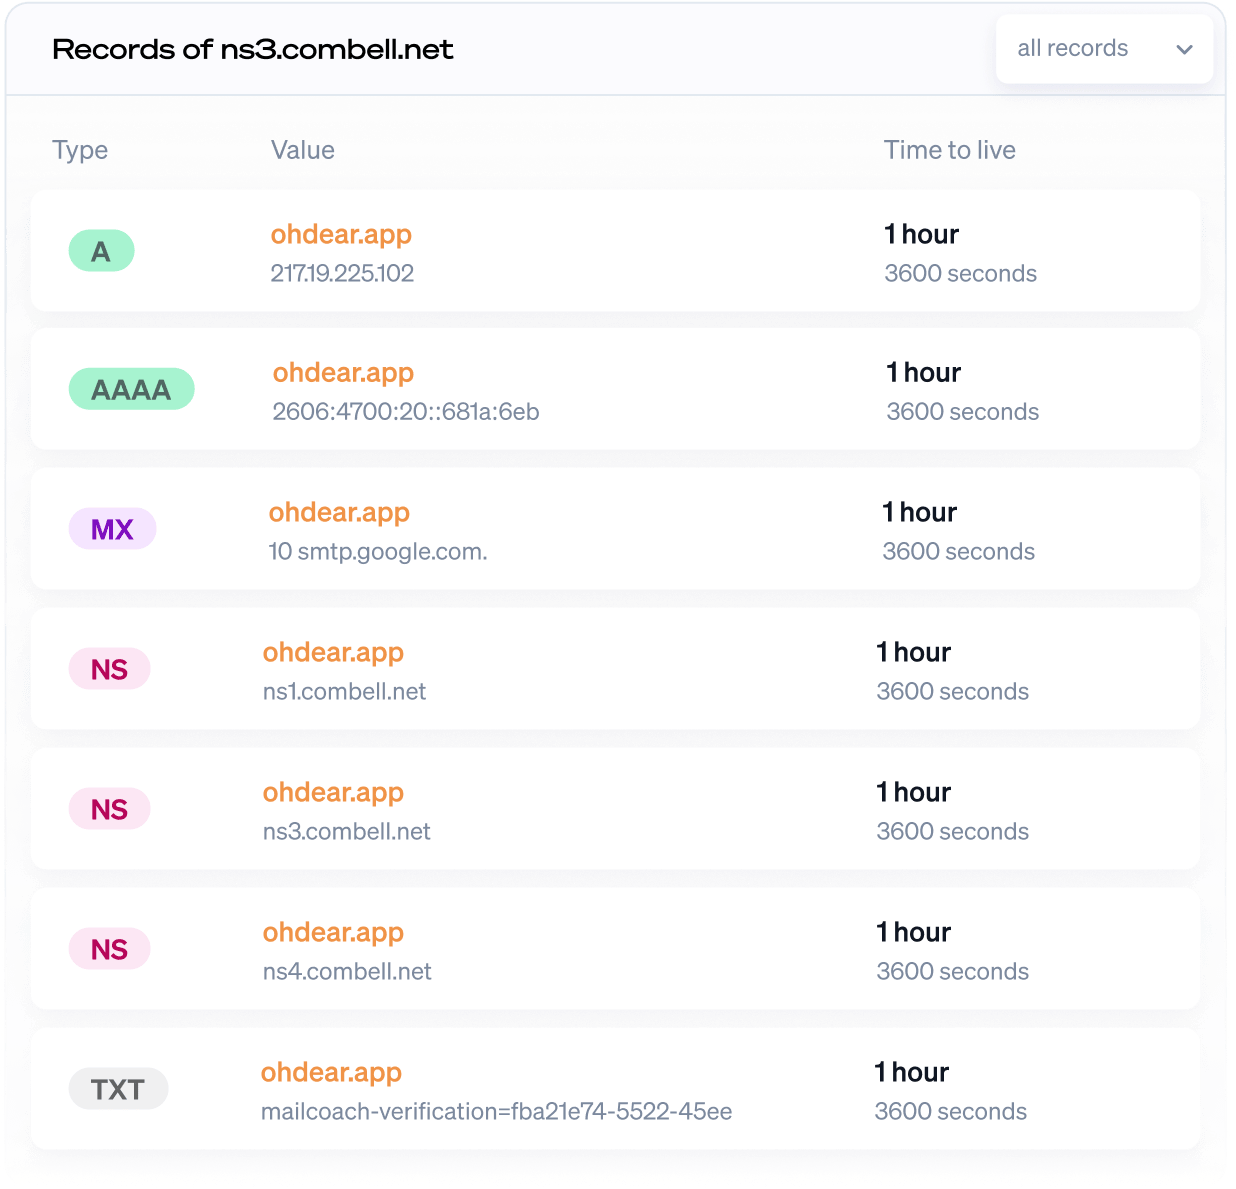
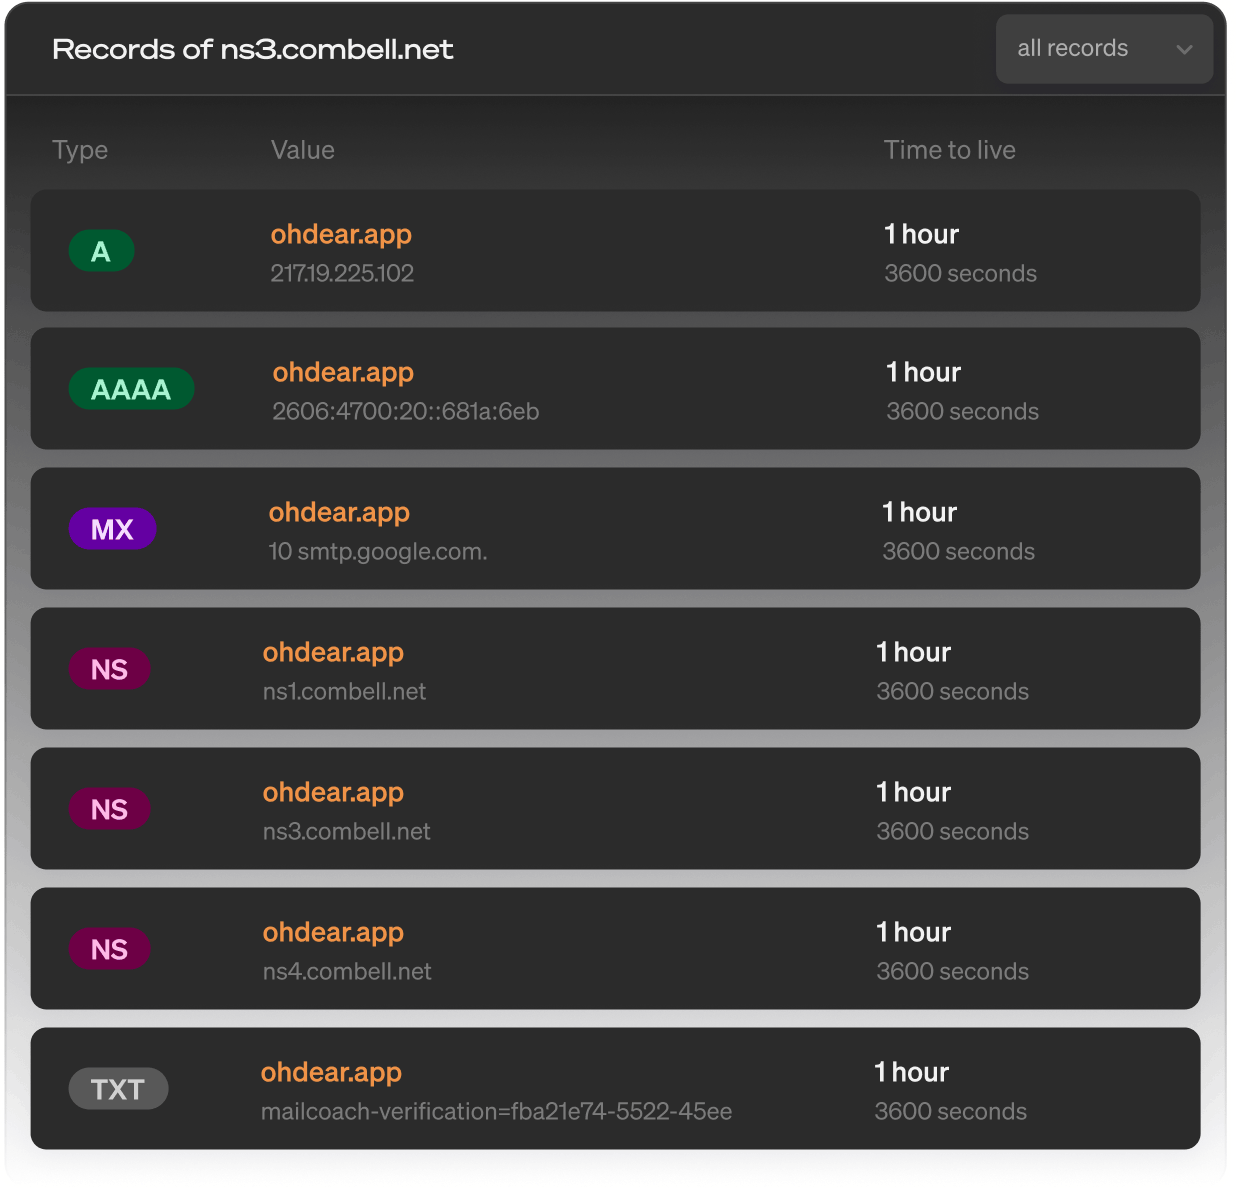
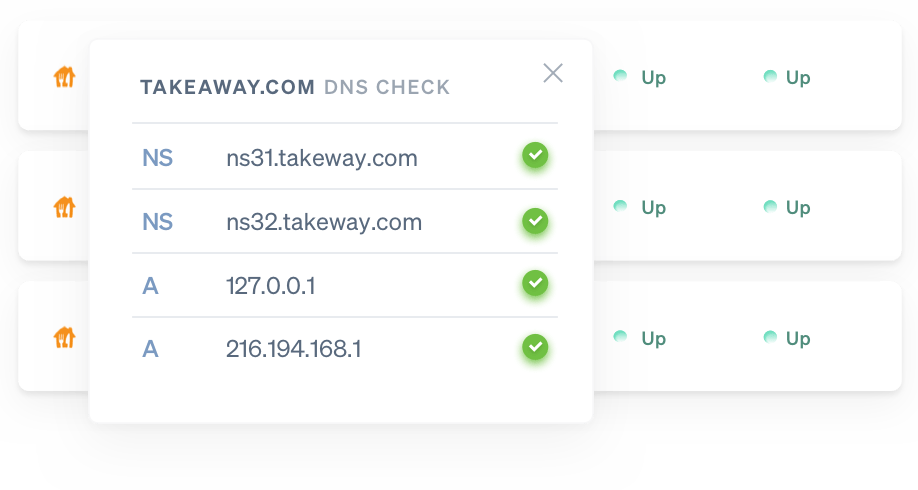
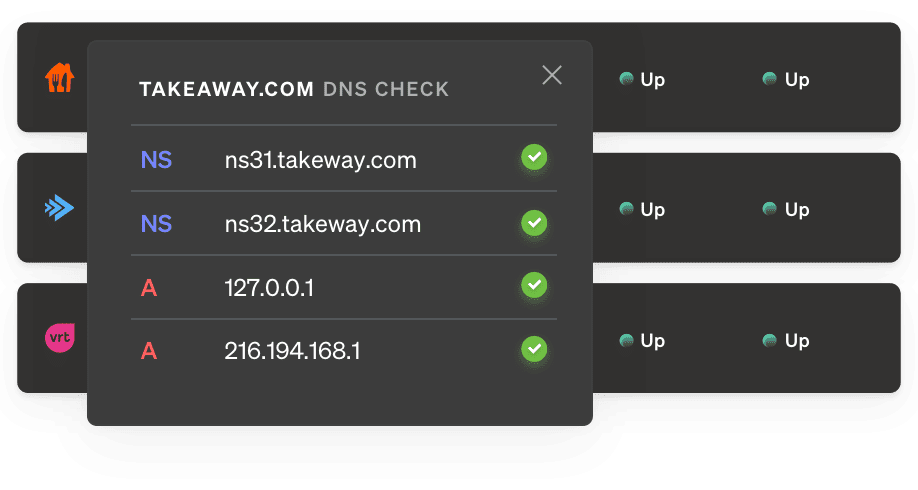
DNS monitoring
DNS changes can break everything. We monitor your records and alert you when something changes, whether it's an unauthorized modification, a propagation issue, or a registrar problem.
Especially valuable when you're managing DNS for multiple domains or working with CDNs and load balancers.
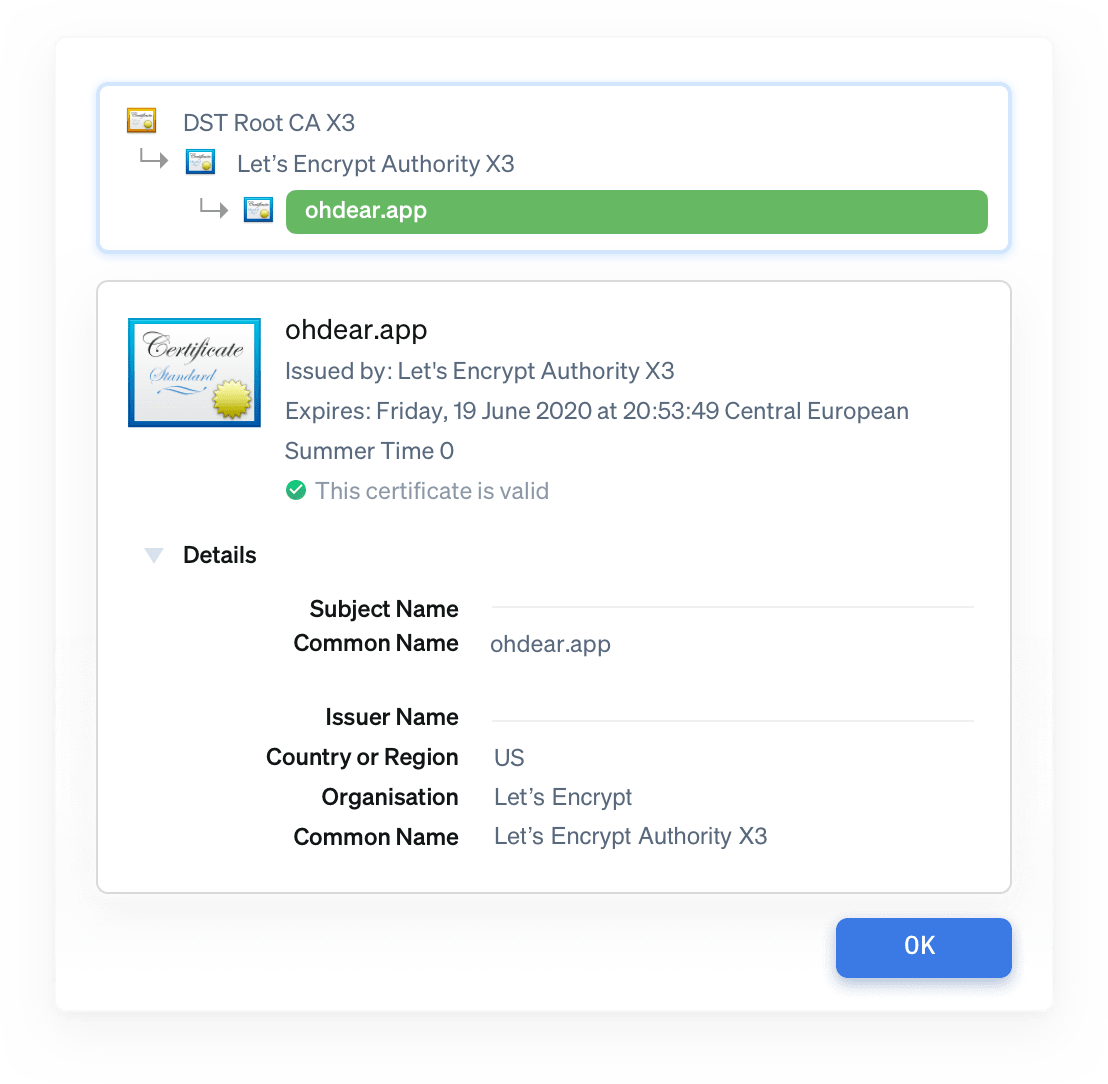
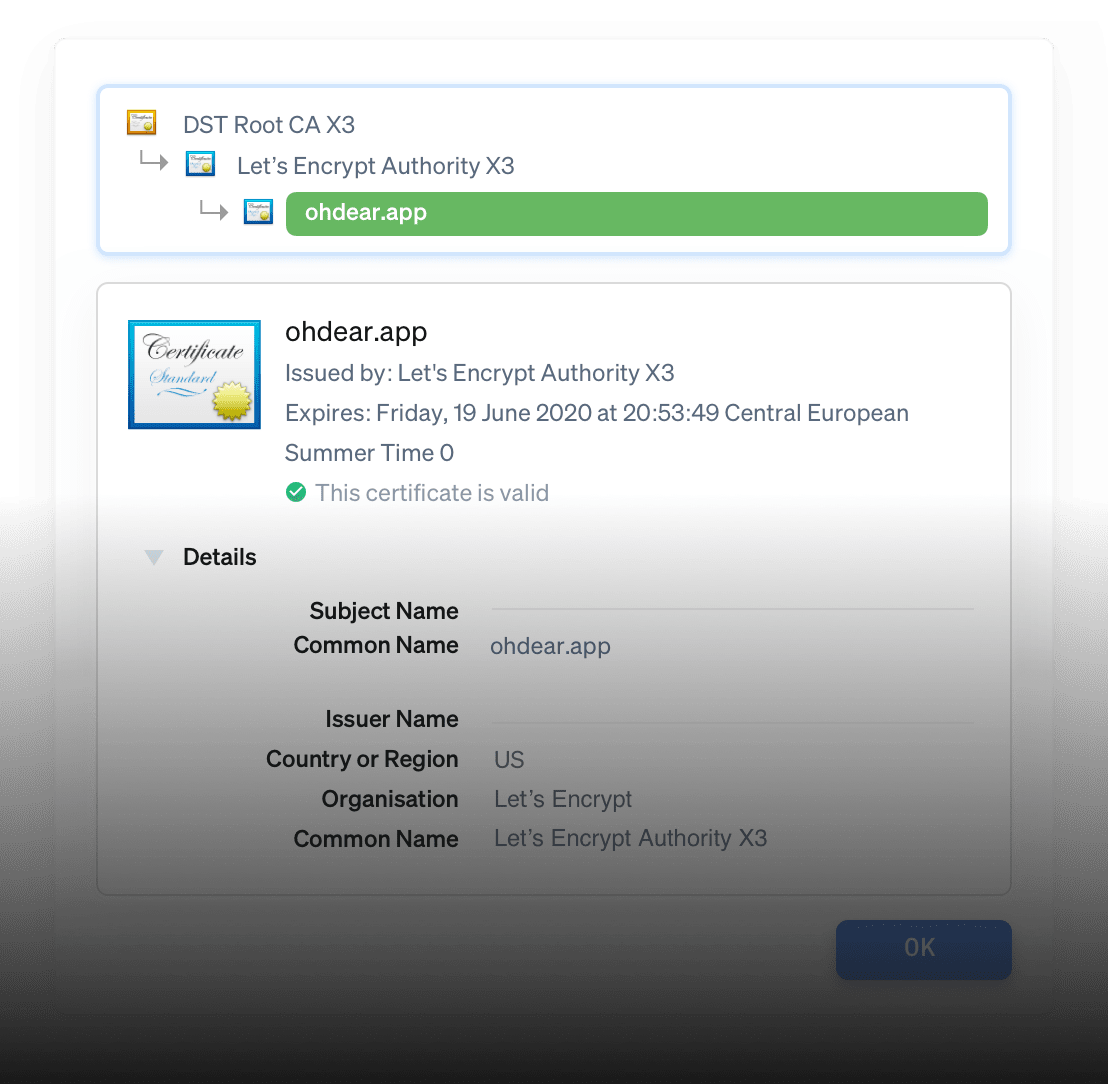
SSL certificate management at scale
Track certificate expiry across all your domains. Get alerts 30, 14, and 7 days before expiration so you have time to renew, not scramble.
We also catch chain issues, weak algorithms, and misconfigurations that cause intermittent HTTPS failures.
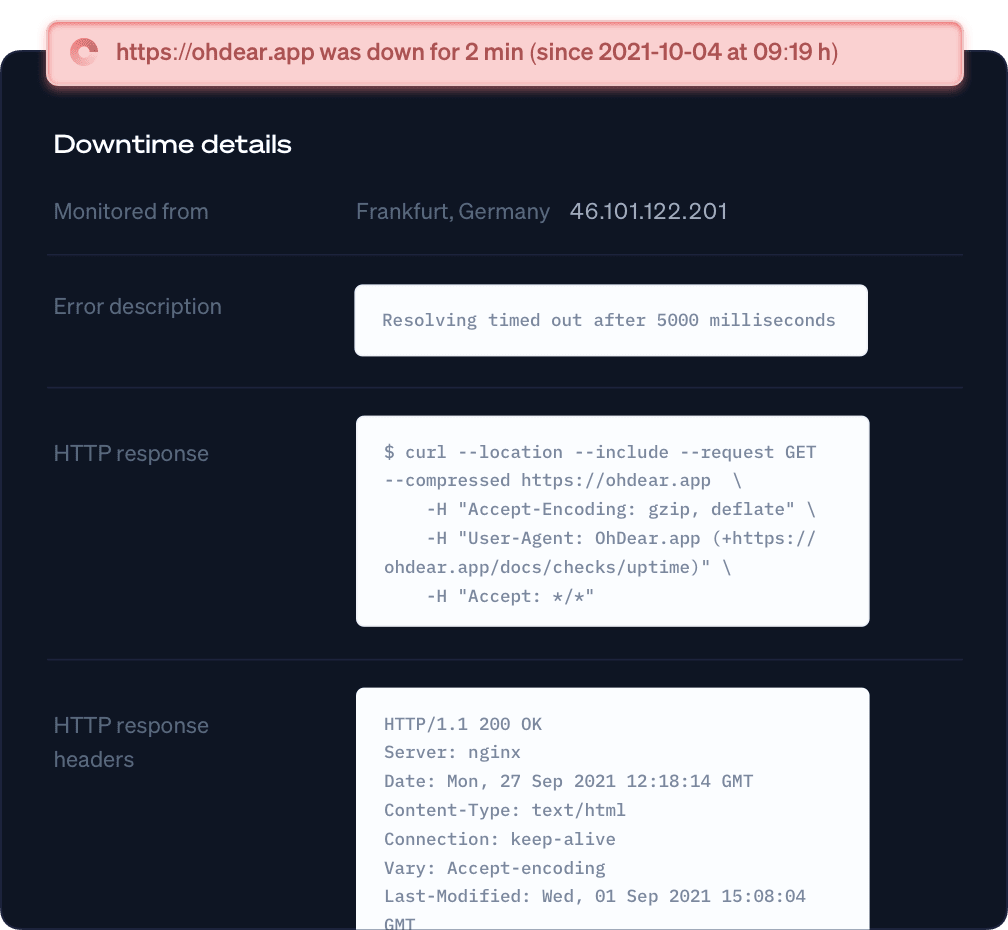
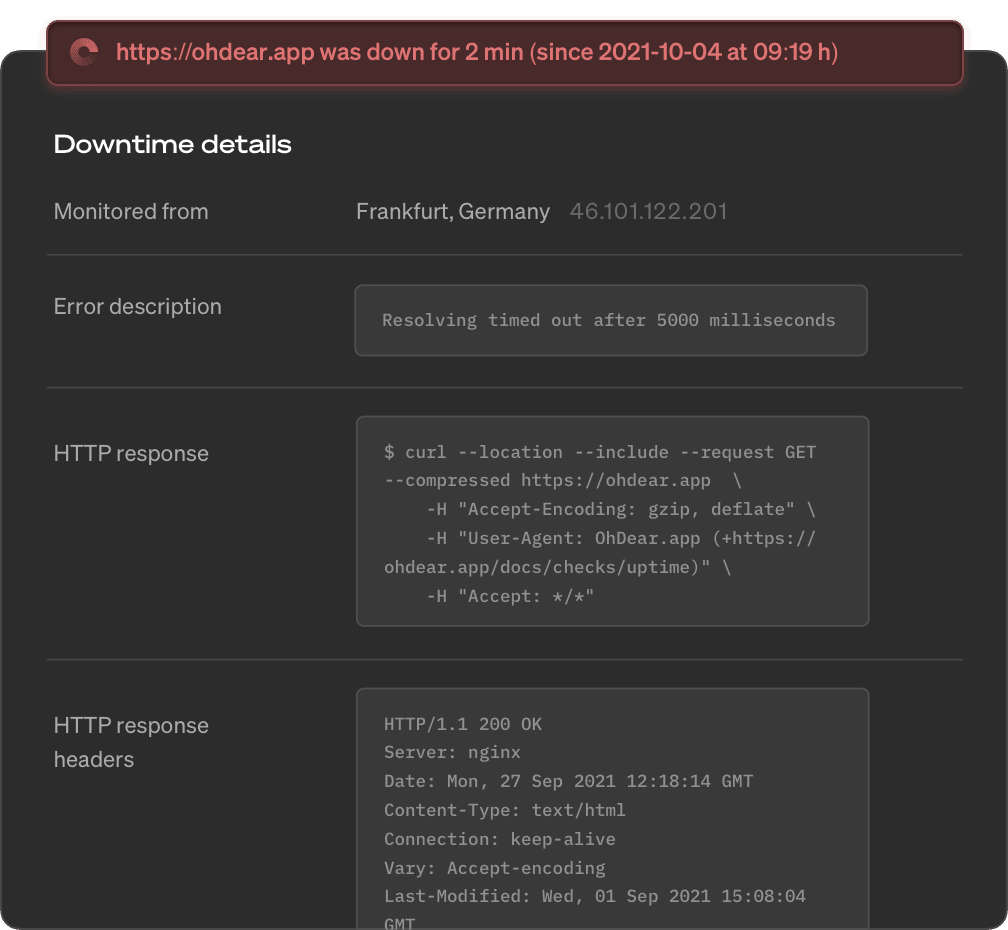
External uptime verification
Internal monitoring misses network-level issues. We check your services from multiple global locations every minute, catching problems that your internal tools can't see.
When your load balancer, CDN, or DNS fails, you'll know, even if your servers are technically running.
| Component | Value |
|---|---|
| Url | https://urlxyz.com |
| Error description | Operation timed out after 5001 milliseconds with 0 bytes received |
Downtime verified from Paris, France and Bangalore, India
Downtime verified from Paris, France and Bangalore, India
urlxyz.com has recovered after 2m. full report: https://ohdear.app/monitors/83/checks/411
urlxyz.com seems down! Error: HTTP/500 Downtown verified from Paris, France and Frankfurt
Pushover has been successfully enabled. We'll notify you when something goes wrong.
 ntfy
ntfy
urlxyz.com has recovered after 2m. full report: https://ohdear.app/monitors/83/checks/411
ntfy
urlxyz.com seems down! Error: HTTP/500 Downtime verified from Paris, France and Frankfurt
ntfy
ntfy has been successfully enabled. We'll notify you when something goes wrong.
urlxyz.com has recovered after 2m. full report: https:/ohdear.app/monitors/83/checks/411
urlxyz.com has recovered after 2m. full report: https:/ohdear.app/monitors/83/checks/411
Text messages for urlxyz.com have been successfully enabled. We'll notify you when something goes wrong.
$_TOKEN="your API token"
$ curl -X GET "https://notifyservicexyz.com/api/alert/urlxyzcom" \
-H "Authorization: Bearer $_TOKEN" \
-H "Accept: application/json" \
-H "Content-Type: application/json"
urlxyz.com has recovered after 2m. full report: https://app.opsgenie.com/monitors/83/checks/411
urlxyz.com seems down! Error: HTTP/500 Downtown verified from Paris, France and Frankfurt
Opsgenie has been successfully enabled. We'll notify you when something goes wrong.
urlxyz.com has recovered after 2m. full report: https://pagerduty.com/monitors/83/checks/411
urlxyz.com seems down! Error: HTTP/500 Downtown verified from Paris, France and Frankfurt
PagerDuty has been successfully enabled within Oh Dear. Notifications are enabled.
Alerts that fit your on-call rotation
Route alerts to whoever's on call. Integrate with PagerDuty and Opsgenie for proper escalation, or use Slack and webhooks for less critical notifications.
Different alert channels for different check types mean the right person gets paged, not the whole team.
Cron and scheduled task monitoring
Backups, log rotation, data syncs, all those jobs that run in the background and fail silently. We monitor them all and alert you when they stop running or take too long.
Works with any cron job that can hit a URL, no agents or special setup required.
Status pages for incident communication
When your infrastructure goes down, your status page shouldn't go with it. Our status pages run on separate infrastructure so stakeholders can check status even during major outages.
Clear incident communication reduces support load and keeps everyone informed during the moments that matter most.
Let's get technical (if you're into that)
Automate your monitoring setup with our API and Terraform provider. Treat monitoring as code, version it, review it, and deploy it alongside your infrastructure.
Terraform provider
Define your monitors alongside your infrastructure:
terraform {
  required_providers {
    ohdear = {
      source = "articulate/ohdear"
    }
  }
}

resource "ohdear_site" "production" {
  team_id = var.ohdear_team_id
  url     = "https://app.example.com"
}

resource "ohdear_site" "database" {
  team_id = var.ohdear_team_id
  url     = "db.example.com:3306"
}
REST API
Add monitors from your deployment scripts:
curl -X POST https://ohdear.app/api/sites \
  -H "Authorization: Bearer $OHDEAR_API_TOKEN" \
  -H "Content-Type: application/json" \
  -d '{
    "url": "https://app.example.com",
    "team_id": 1234,
    "checks": ["uptime", "certificate_health", "dns"]
  }'
Enable maintenance mode during deploys:
# Start maintenance before deploy
curl -X POST https://ohdear.app/api/sites/123/maintenance-period \
  -H "Authorization: Bearer $OHDEAR_API_TOKEN" \
  -d '{"seconds": 600}'

# Your deployment...

# Stop maintenance when done
curl -X DELETE https://ohdear.app/api/sites/123/maintenance-period \
  -H "Authorization: Bearer $OHDEAR_API_TOKEN"
Security you can trust
We understand the sensitive nature of monitoring access. Your infrastructure data matters, and we don't take that responsibility lightly.
- Two-factor authentication available for all accounts
- TLS 1.2+ encryption for all data in transit
- GDPR compliant with data minimization practices
- No data sharing with third parties, ever
- Strict access controls with regular internal audits
Frequently asked questions


Can I monitor TCP ports like MySQL and Redis?
Yes. Oh Dear monitors any TCP service on any port. When MySQL on 3306 stops accepting connections or Redis on 6379 goes silent, you get alerted before cascading failures hit your apps. Great for databases, cache servers, queue workers, and SMTP servers.
How does Oh Dear integrate with my on-call rotation?
We integrate natively with PagerDuty and Opsgenie for proper escalation. You can route different check types to different teams, so TCP port failures page your infrastructure team while HTTP issues go to the application team. Slack and webhooks are also available for less critical alerts.
Can I use Terraform to manage my monitors?
Yes. Our Terraform provider lets you define monitors as code alongside your infrastructure. Version your monitoring config, review changes in PRs, and deploy monitors automatically when you spin up new environments. Infrastructure as code for your monitoring setup.
Why do I need external monitoring if I have internal tools?
Internal monitoring misses network-level issues. We check your services from multiple global locations every minute, catching problems that your internal tools can't see. When your load balancer, CDN, or DNS fails, you'll know even if your servers are technically running.
How do you monitor DNS changes?
We track your DNS records and alert you when anything changes, whether it's an unauthorized modification, a propagation issue, or a registrar problem. This is especially valuable when managing DNS for multiple domains or working with CDNs and load balancers where DNS changes can break everything.
Do you publish your monitoring IP addresses for firewall whitelisting?
Yes. We publish a fixed list of static IP addresses that our monitoring checks originate from. You can whitelist these IPs in your firewalls and security configurations. View our complete IP list.
Wait, there's even more
API & endpoint monitoring
Call your endpoints every minute and validate what they actually return: status codes, response bodies, headers and response times. Webhooks and scheduled jobs included.
Continuous certificate monitoring
SSL certificates are essential in website security. We check all your certificate expiration dates & alert any change we detect.
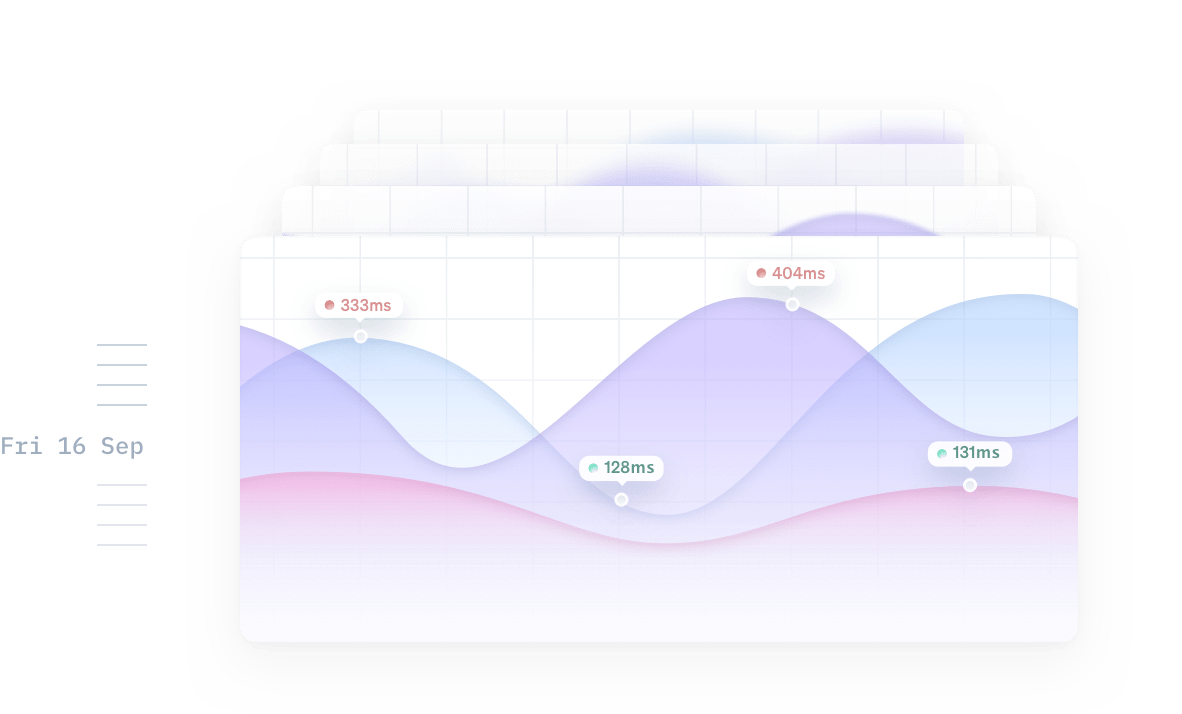
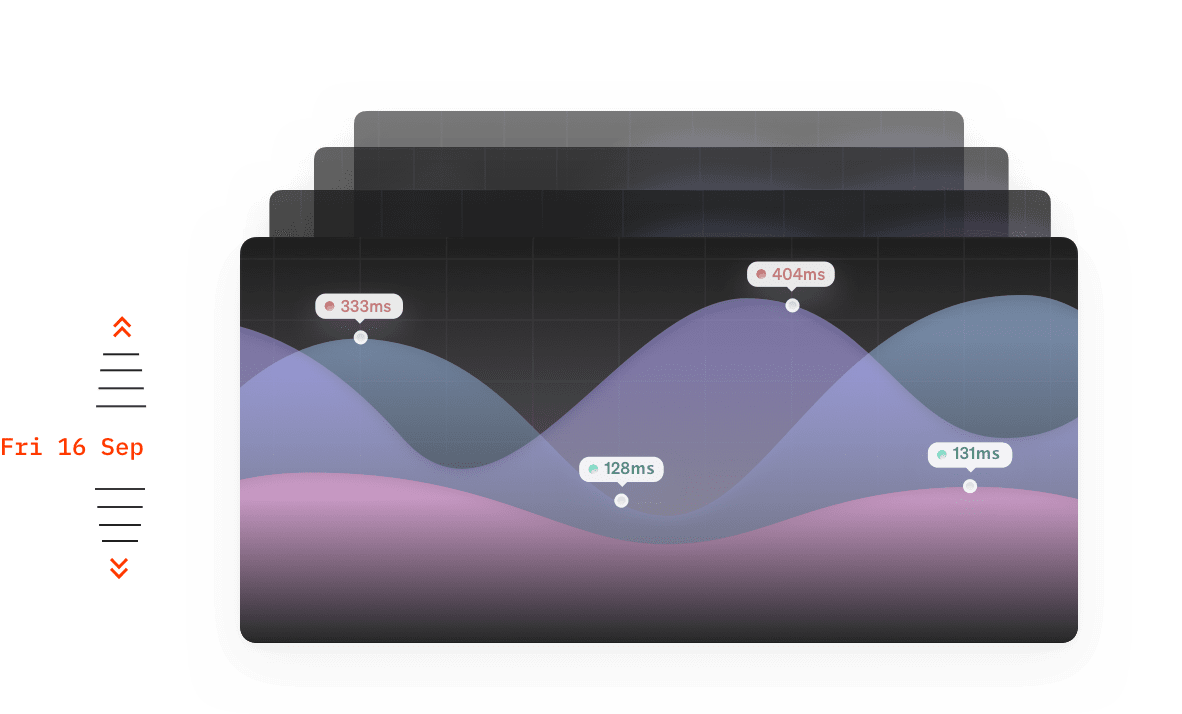
Performance monitoring
We provide highly detailed performance monitoring and insights. We'll notify you as soon as we detect your website is getting slow.


Fast and insightful notifications
Get notified instantly as soon as we detect an issue or an important change. Enable any channel you use, you're in full control.
Scheduled task monitoring
Your cron jobs (Linux) and scheduled tasks (Windows) are the heart of your data processing. We can monitor every single one of them.

Broken page & mixed content
We crawl and index your entire website, just like Google. As soon as we detect a broken link on your site we will let you know.
DNS record monitoring
Receive a notification whenever your DNS records are modified - intentionally or maliciously - so you can act and verify faster.
Application health monitoring
A lot can go wrong inside your app and server. Disk space may fill up, or the database may go down. We'll notify you when something is off.
Beautiful public status pages
In times of crisis, a public status page allows you to communicate to your clients. We'll host your status page so it's always available.
laravel.comign.comtakeaway.comWebsite uptime monitoring
When your website goes down we'll let you know instantly. Now you can act before your or your client's brand reputation takes a hit.
Domain monitoring
We can check how long your domain is still registered. If your renewal date is close, we'll notify you. This will avoid you losing your domain.
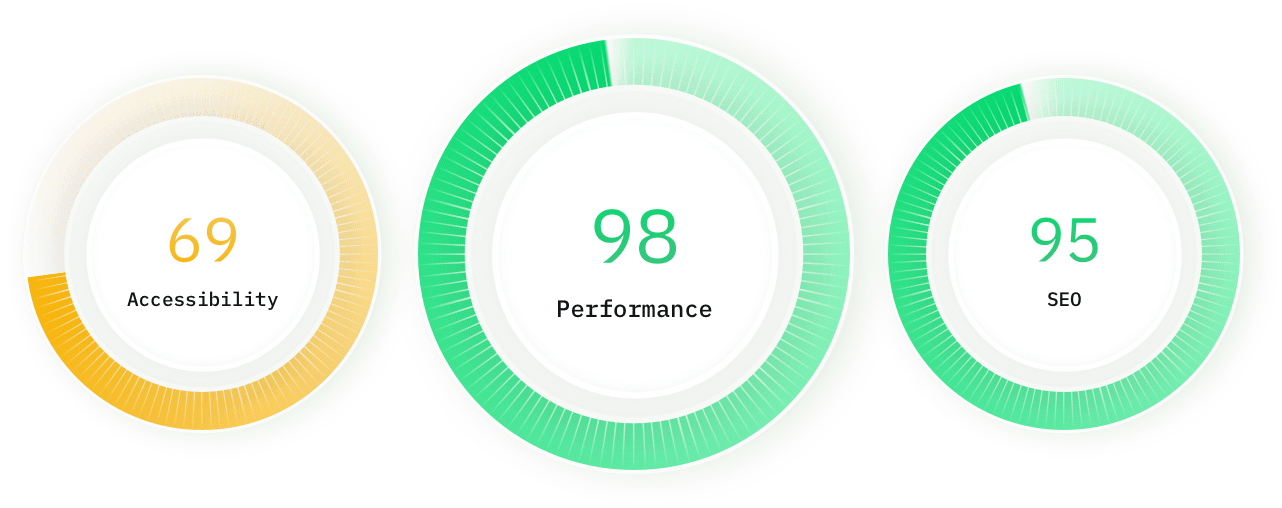
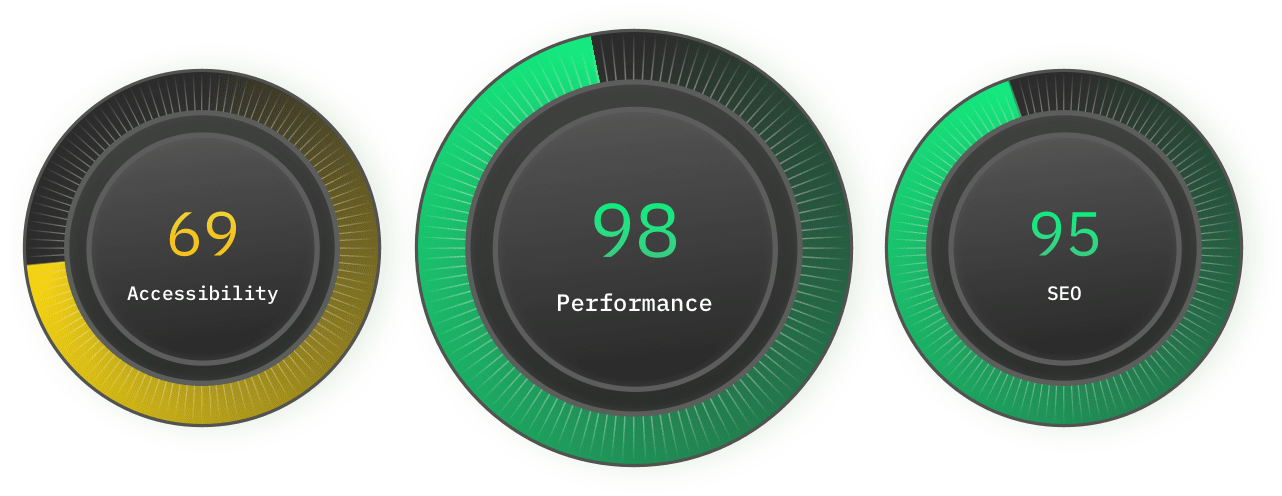
Lighthouse SEO monitoring
We track the speed & performance of your website over time. If we detect your website is suddenly slower, we'll let you know.
Sitemap monitoring
Elevate your SEO strategy and optimize your site. We analyse your sitemap health and check every URL for broken links.
Describe what you want to monitor
AI-powered monitoring
Use AI to verify anything you want on your websites and services with Oh Dear's AI-powered monitoring feature.
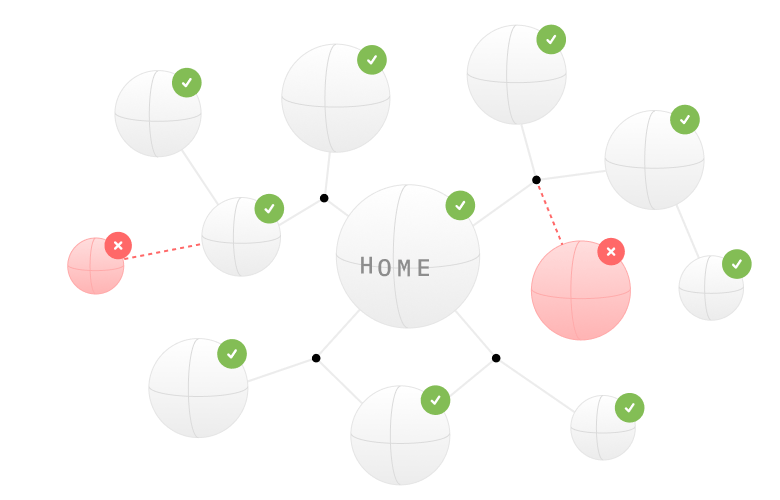
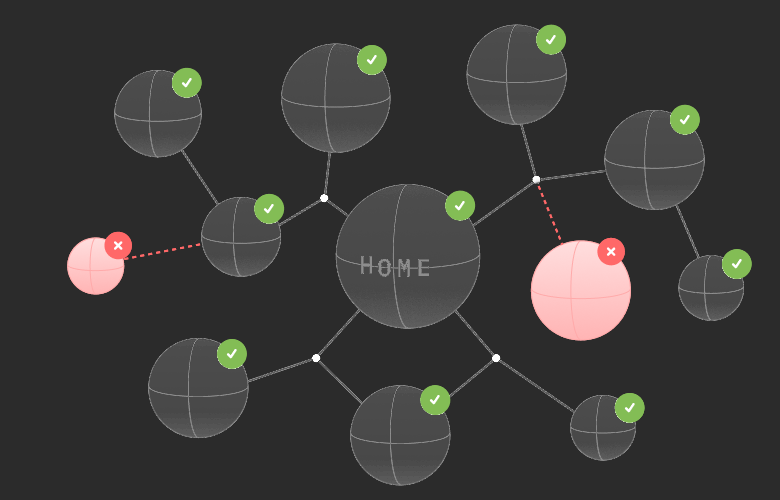
Port scanner
Define which ports should be open, and we scan all 65,535 ports on your server. Get alerted when expected ports go down or unexpected ports appear.
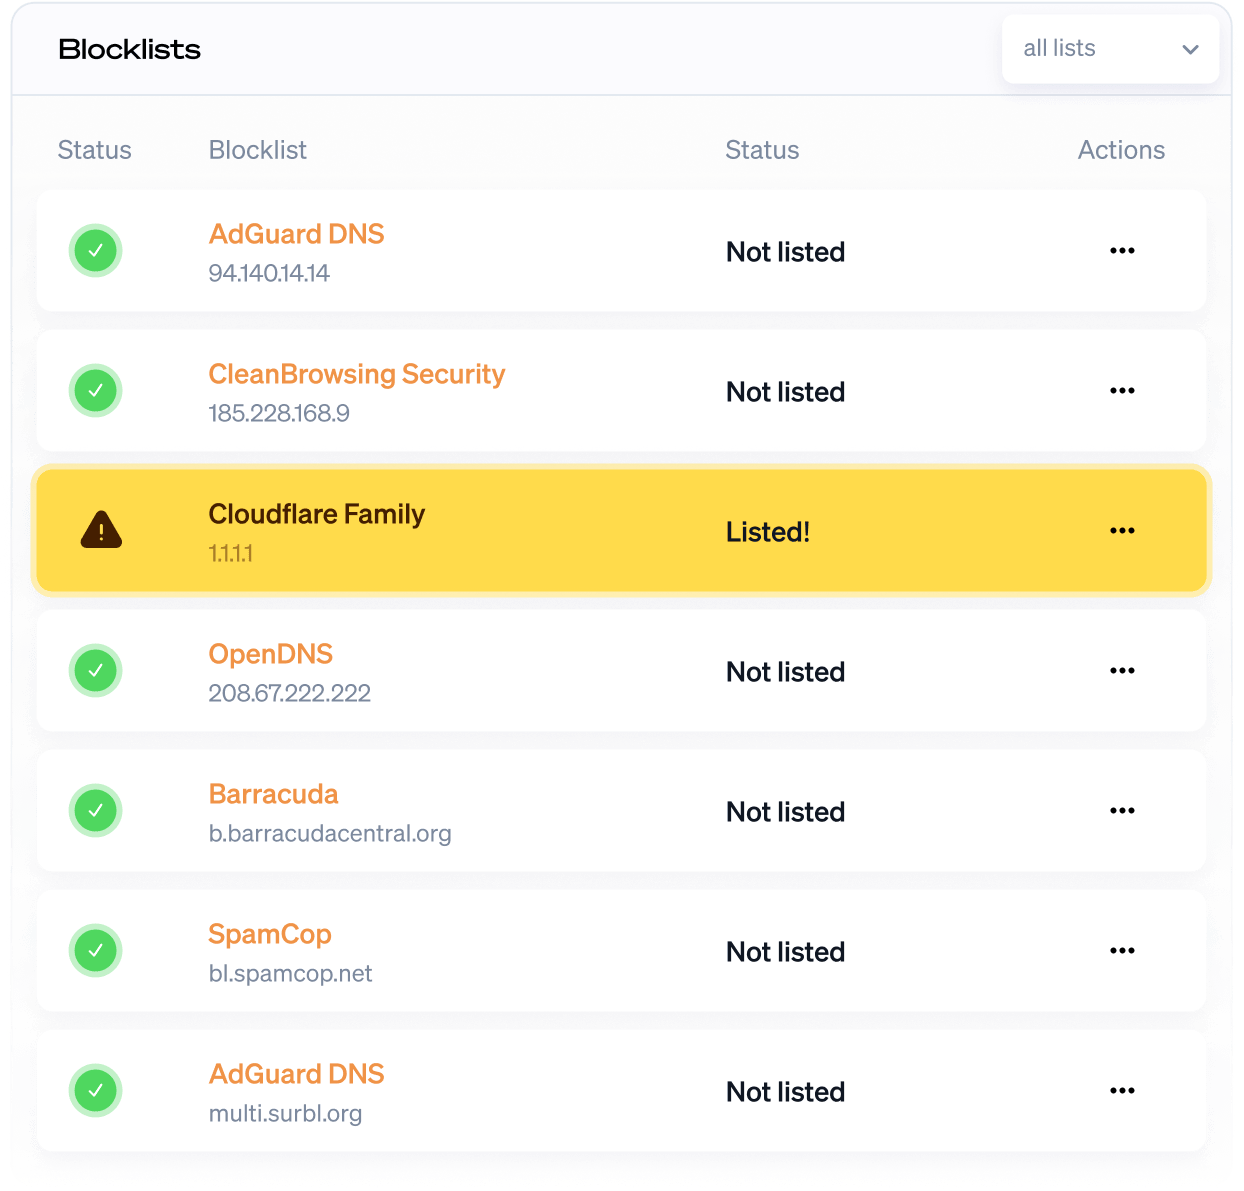
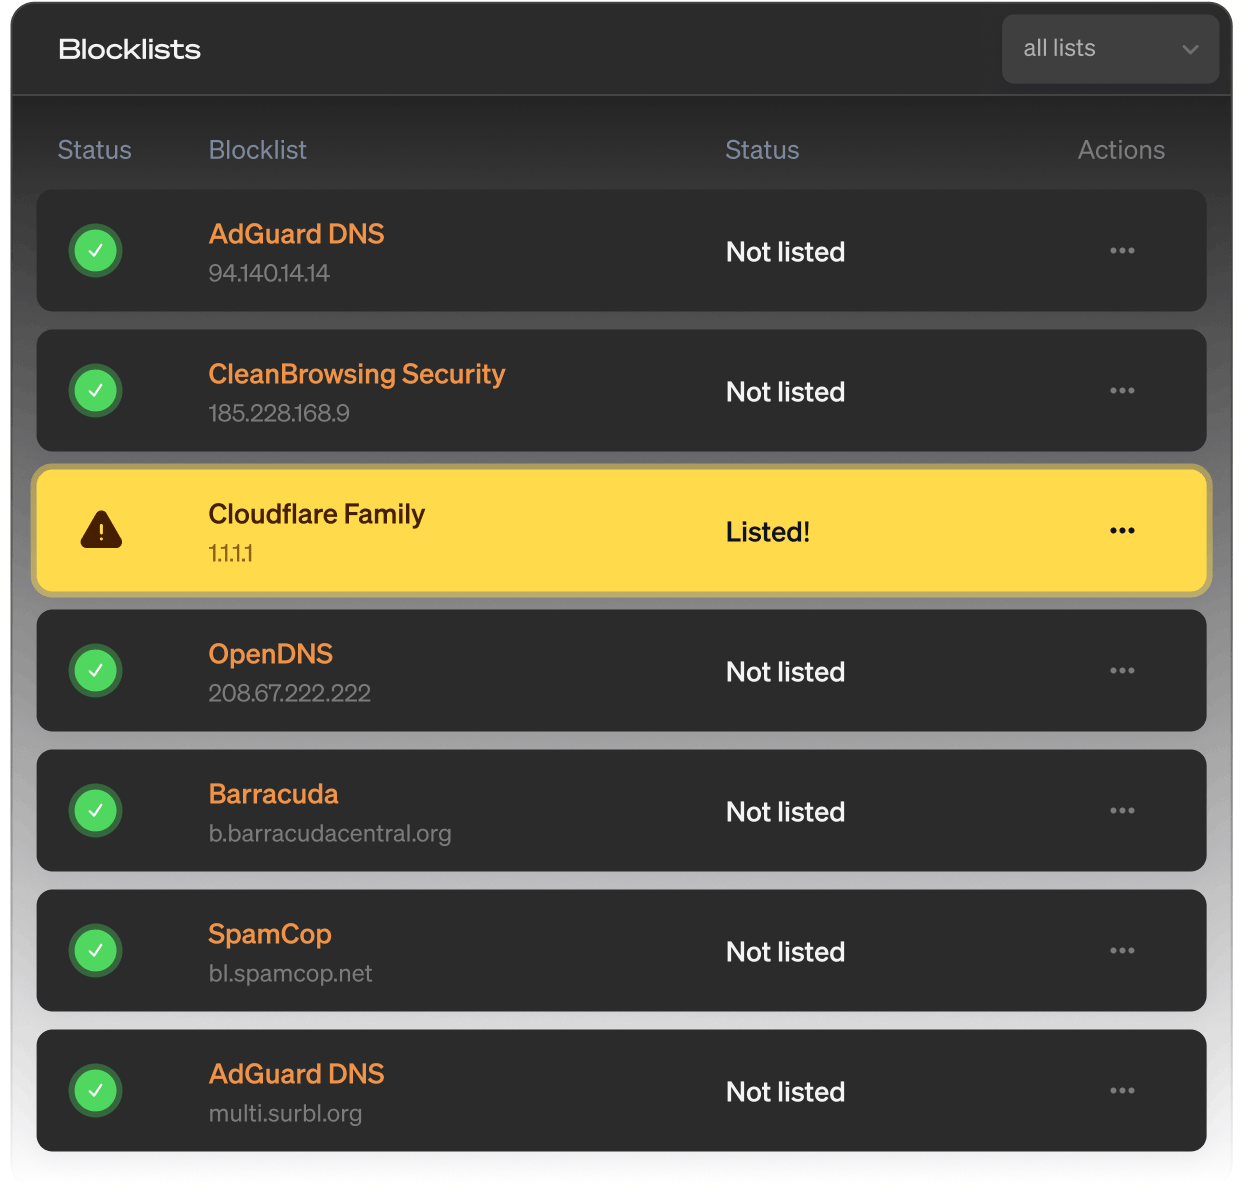
DNS blocklist monitoring
DNS blocklist monitoring helps you stay off spam and ad-block lists. Get notified when your DNS is blocked by a blacklist.
Single Sign-On (SSO)
Connect Oh Dear to your identity provider. Your team signs in with the credentials they already use.
GDPR & EU data residency
Oh Dear is a Belgian company. Your monitoring data is stored in the EU, with a signable DPA and a public subprocessor list.
Start monitoring your infrastructure
Start a no-strings-attached 10-day free trial. You're all set in less than a minute. (No credit card needed.)
Not convinced yet? Need help? Get in touch via support@ohdear.app.