The effects of the Cloudflare outage on Oh Dear
Published on November 19, 2025 by Mattias Geniar

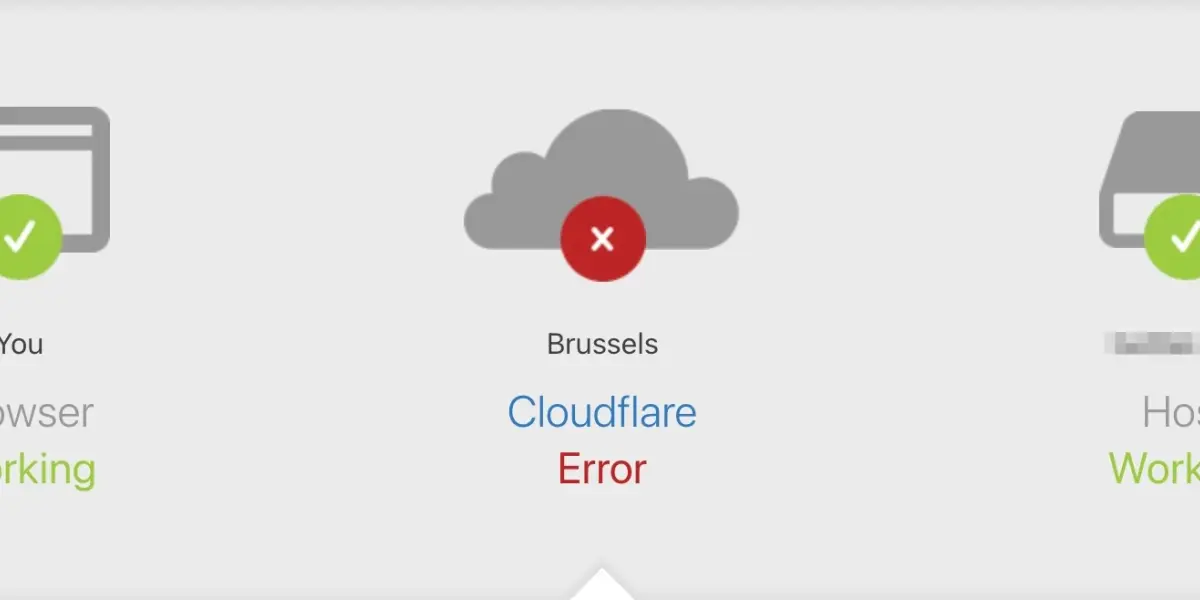
Last night, Cloudflare experienced one of their biggest outages in the past decade. Almost all websites behind Cloudflare's proxy/DDoS-protection service were offline for anywhere between 1–3 hours. That included our own website & application, while our status pages remained online the entire time.
This post examines some of our lessons learned, and we'll share our insights into what we saw during the outage.
Cloudflare, a net positive for our industry #
Let me start by chiming in on the public debate: has the internet decided to centralize too much around a few key players (Cloudflare, AWS, Google, ...)? Probably.
Should we now all move away from these big players to decentralize the web again? Probably not.
Despite Cloudflare's outage yesterday, I firmly believe they're a net positive for our industry, advancing the protection, speed, and availability of websites globally. Any major provider will experience downtime. I'm confident there will be a solid and transparent post-mortem of this incident with many lessons learned to prevent this from happening again. (Update: Cloudflare's post-mortem on the incident is now available)
So no, we won't suddenly move everything away from Cloudflare in a knee-jerk reaction, but we will be conscious to have procedures and workflows readily available to temporarily move away from Cloudflare when there is prolonged downtime.
Now, on to the real stuff!
Our Web UI was offline, our status pages & monitoring weren't #
Oh Dear itself sits behind Cloudflare. We've had the bad luck of experiencing some DDoS attacks a few years ago and have since opted into Cloudflare's Pro plan for better protection against this. As a result, during the outage, this was the availability of our services:
- Website: ❌
- Dashboard: ❌
- API: ❌
- Monitoring engine: ✅
- Notification engine: ✅
- Status pages: ✅
The problem we (and our clients) were facing: while status pages were online, our users couldn't post any updates to them because they couldn't log in to the main application that has the interface to manage those status pages.
This essentially turned status pages—unless users opted into the auto-updates based on our uptime monitors—into a stale and outdated communication channel. Only when our dashboard services were restored could our users start posting updates.
All our actual monitoring & notification engines remained online and performant at all times.
Temporarily disabling Cloudflare #
Because of this, we temporarily disabled Cloudflare for our website so that our users could access our service again.
This turned out to take slightly more time because the Cloudflare Dashboard itself was offline during their outage (because challenges.cloudflare.com, their "I'm not a Robot" service, was offline and prevented logins to their dashboard). Only once the CF dashboard was available again could we disable proxying through Cloudflare.
Lesson learned: we need a readily available DNS backup at our domain registry, allowing us to more easily switch nameservers away from Cloudflare to a third party in the case of an emergency. We have backups of our DNS records, but there are many of them, and the process to restore those was still manual and too time-consuming.
Our ping endpoint stays behind Cloudflare #
Users of our cron job/scheduled task monitoring might have noticed notifications about missed scheduled tasks because the callback URL ping.ohdear.app is also routed through Cloudflare.
This was also unavailable during the outage. We do, however, have internal systems that prevented ~99% of the false alerts related to those cron job monitors from being sent.
Every 4 seconds, we ping our own endpoint and expect the result to be processed in the following seconds. This system caught the unavailability of the ping endpoint early on and muted most of the alerts for our clients. Only during the recovery/early downtime—when our system hadn't caught this yet—have we sent some notifications to users.
Lessons learned: our internal system worked well for this particular use case, but we'll investigate options around service recovery times to ensure we don't send notifications that were just on the edge of the Cloudflare downtime.
Increased system load for downtime verifications #
The happy path of uptime monitoring is fairly straightforward: make an HTTP (or ping or TCP) request; if the service responds as expected, the service is considered up. All is well.
The unhappy path, where we detect downtime, is more resource-intensive: we'll do that exact same monitor request but route it via a different set of servers (technically: a different datacenter provider but within the same geographical continent) and expect that to also confirm the downtime.
This means that downtime detection doubles our system load because we can no longer just do a single check to confirm something is up; we need a second verification.
We have around 50+ servers worldwide, here's a screenshot of the network-throughput of one of our satellite servers:
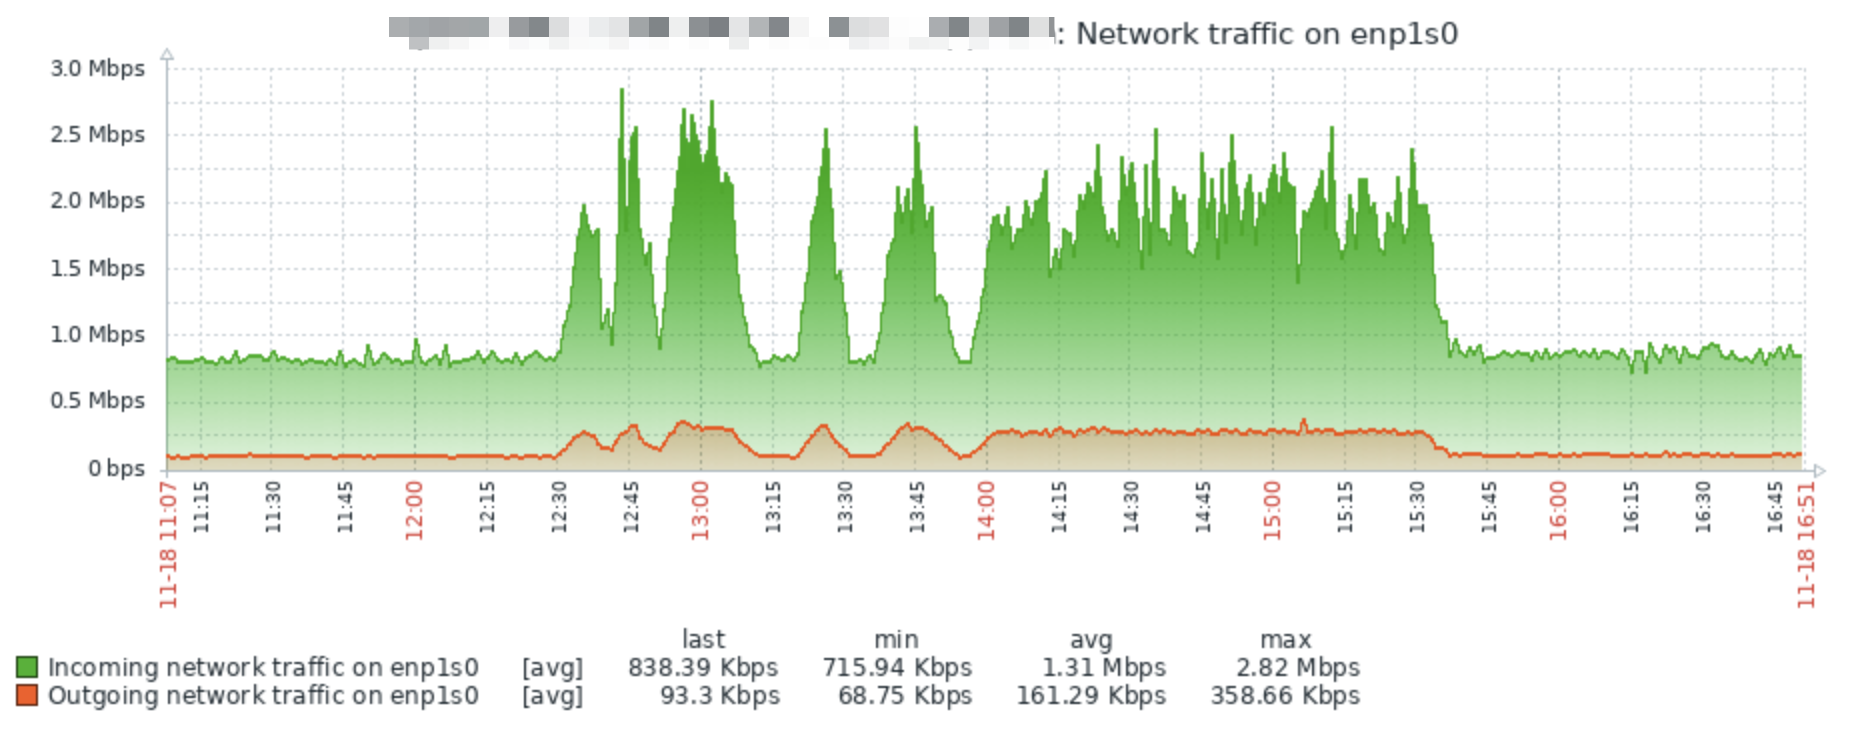
In our capacity planning, we take this into account: our systems aren't running at their limits and always have the capacity to double their throughput at any moment in time, especially for these circumstances.
Lessons learned: there's a reason we keep 50% spare capacity at all times—this incident shows why. We'll keep doing so.
A spike in notifications sent #
It makes sense that when Cloudflare goes down, we'll start notifying a lot of our users that their website is down. Yesterday can be considered a stress test on our own systems as well, and I'm glad to see our choices in architecture have ensured that this was a smooth process.
At any given time, some of the websites we monitor are down, and we'll be notifying those users. Yesterday was a bit different, though.
For any of the following data, timestamps are shown in UTC.
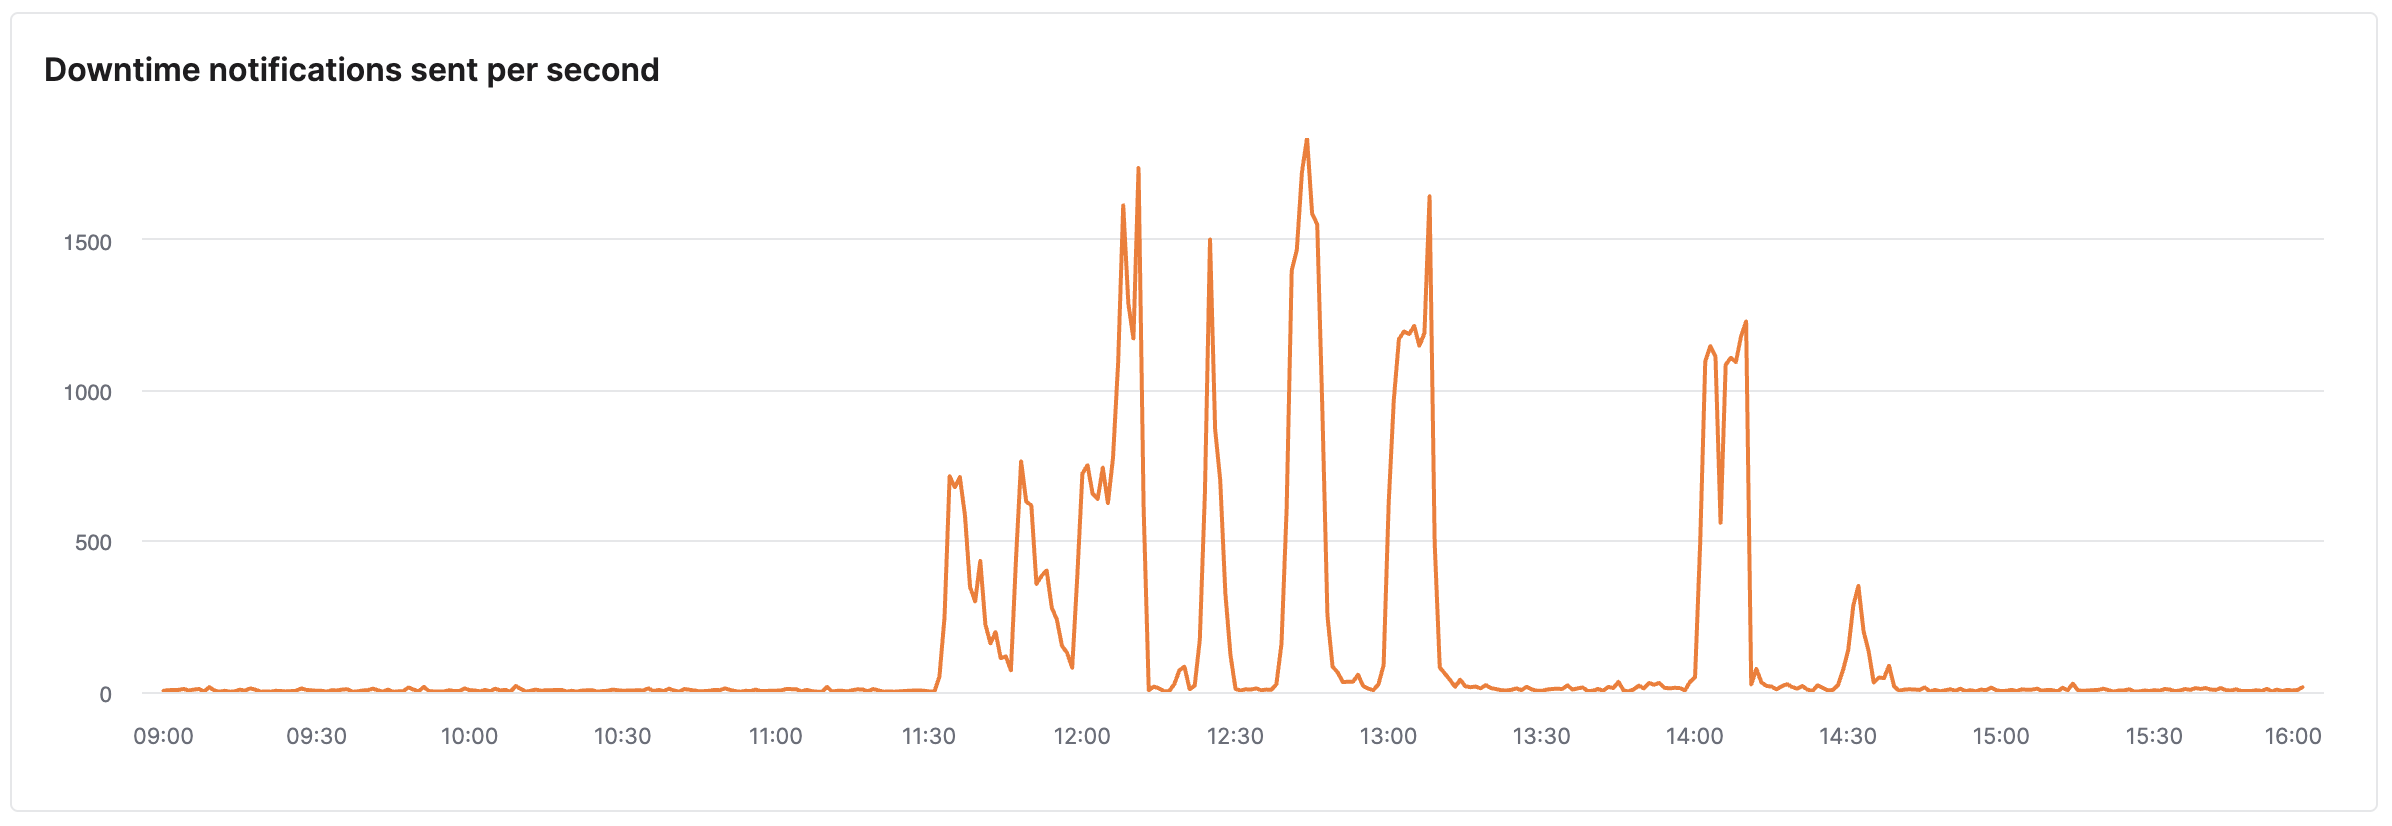
At the peak, we were sending ~1,500 notifications per second. This is a mix of channels—some via email, some Slack, some Discord, etc.—depending on the settings of our users.
The downtime wasn't consistent either, so during the same period we also sent out a lot of recovery notifications (only to send new downtime notifications a few minutes later when the service was disrupted again):

During our peak, we observed at most a 1- to 2-minute delay between detecting the downtime and sending the notification because our queues were being hit much harder than ever before. We quickly scaled up capacity for processing outbound notifications and swiftly processed all notifications in < 1 minute again.
We also monitor our own service with some of our competitor tooling, and we observed some of their email notifications only arriving more than an hour later than the actual incident. We're proud to say that wasn't the case for us.
Lessons learned: our architecture allows for sending out many notifications in a short period of time with minimal disruption.
Where did our users get notified the most? #
We support a myriad of notification options, so where did we send most notifications during this outage?
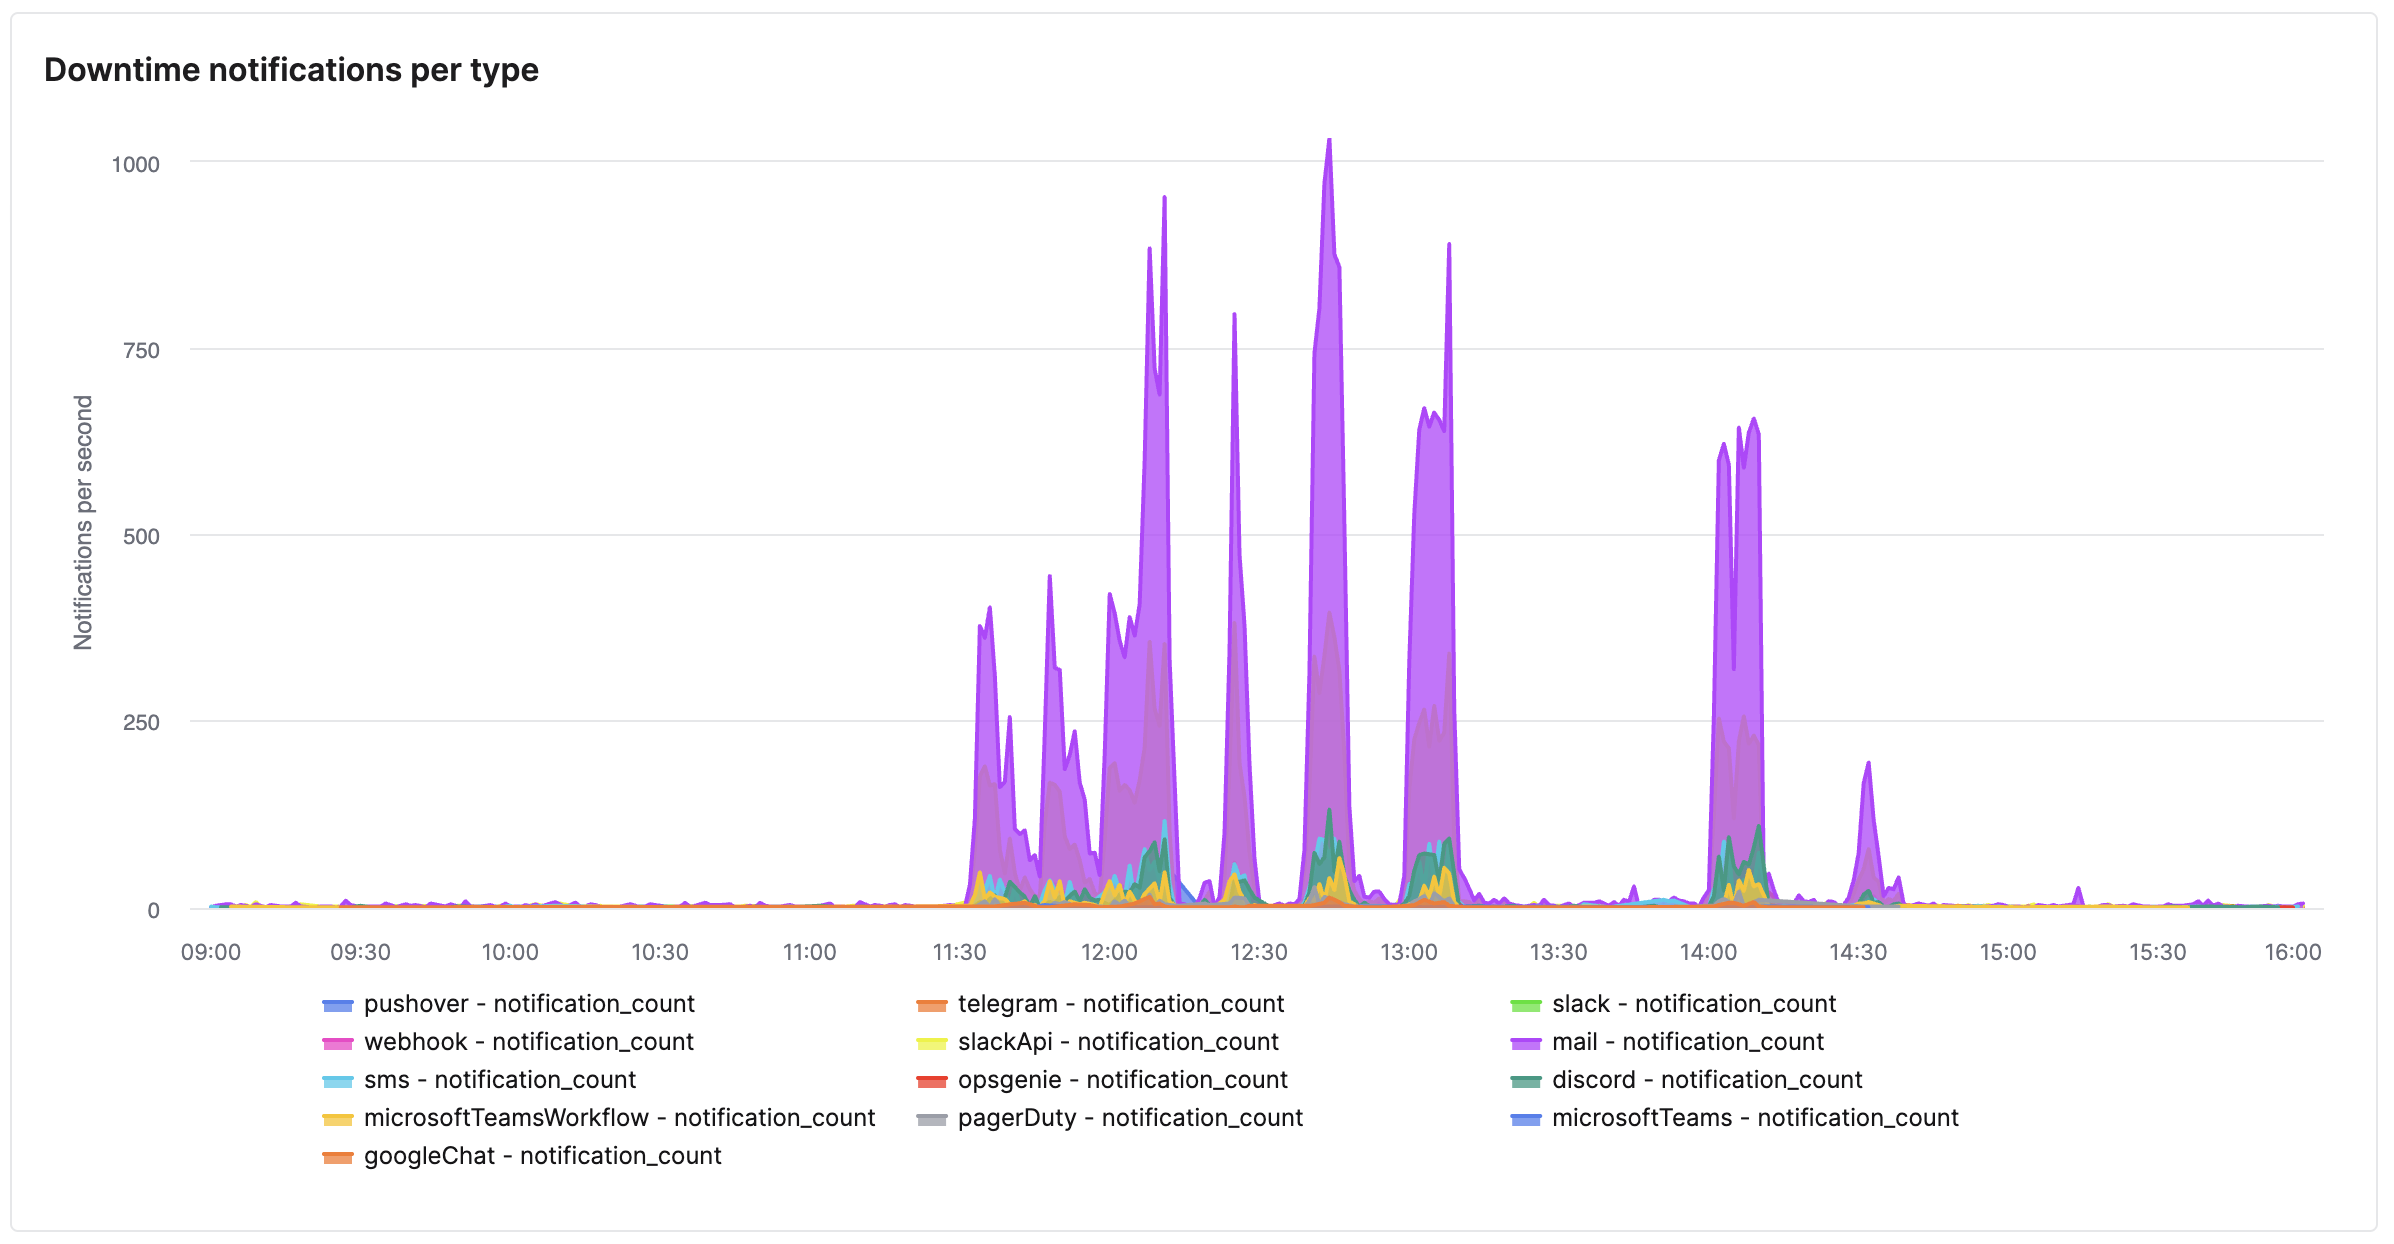
In order of popularity, we sent out most notifications over:
- mail: 54.0%
- slackApi: 18.8%
- sms: 5.1%
- telegram: 4.4%
- discord: 3.8%
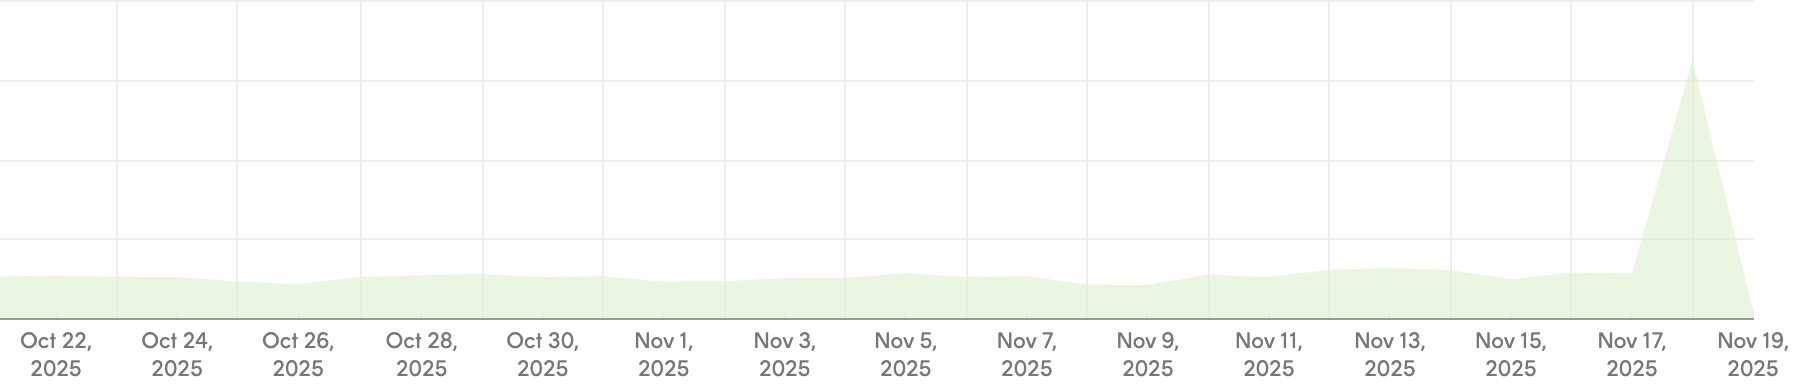
The others are in single digits. Email being the most popular makes sense, as it's the most accessible and it's the one we enable by default if someone signs up to try Oh Dear. The bump in email delivery is also clear from our email delivery stats:
In closing #
There are a few lessons learned from this incident, but we're proud to see how our service performed during a real-life stress test. We can implement some improvements over the coming weeks and prepare even better for a major outage. With the centralization of more of the web, we should prepare for downtime events to potentially have much bigger ripple effects that could affect more services at the same time.
Through our support channels, we heard some of our users request new features, such as:
- Mass-muting of all notifications during an outage like this (initiated by the user)
- Out-of-band access to Status Pages for managing updates/incidents
- An in-app banner highlighting a worldwide issue of downtime
All of these are under consideration. If you missed crucial functionality during this outage, we'd love to hear from you!